Let’s kick things off with the basics! Picture data as the building blocks or raw material of information. It’s unprocessed, unrefined, and exists in its purest form. Think of it as scattered puzzle pieces that don’t really make sense on their own. But when pieced together, they can paint a clearer picture. In essence, data is everything before analysis or interpretation happens.
Here’s an example: imagine you’re keeping track of your fitness journey. Every time you step on the scale, you record your weight. Each measurement like 175 lbs on Monday, 174 lbs on Wednesday, 173 lbs on Friday is a piece of data. At this stage, they’re just individual numbers. Alone, they don’t tell you much beyond.
Characteristics of Data
To truly understand data, let’s break down its key traits. It is:
- Raw and unprocessed: Think of a bundle of numbers, names, or observations without any explanation.
- Context-neutral: Data on its own doesn’t tell a story. A single number like 82 could mean temperature, a test score, or age.
- Volume-rich: There’s no shortage of data. With advancements in technology, we’re swimming in data big data, anyone?. But for this reason, it can feel a bit overwhelming unless structured in a meaningful way.
Where Do We Find Data?
Data is everywhere around us! Here are some common everyday sources:
- Weather Reports: Numbers like temperatures, humidity levels, or wind speeds are raw data before they’re analyzed into forecasts.
- Fitness Apps: The number of steps you walk, calories you burn, or hours you sleep each night is all raw data.
- Social Media: Likes, shares, follower counts these are simply pieces of data waiting to be interpreted.
An Analogy to Bring It Home
If the concept still feels a bit abstract, let’s try to make it more relatable. Imagine you’re baking a cake. Raw data is like your list of ingredients flour, sugar, eggs, butter, etc. Individually, they don’t tell you much about the delicious cake you’re about to enjoy. But without these raw materials, you wouldn’t get a cake in the first place! Data works similarly; it’s the essential ingredient that kickstarts everything else.
Authoritative Advice: Why Care About Data?
You might be wondering, Why does understanding data even matter? Well, here’s the truth: without accurate data, decisions become guesswork. Whether you’re using data professionally for business, marketing, or research or personally, like tracking expenses or health, understanding its raw form is crucial. It’s the foundation upon which knowledge, insight, and smarter decisions are built.
Breaking Down the Concept of Information
Let’s take a moment to chat about information. It’s a term we hear frequently, but what does it truly mean? And more importantly, why does it matter so much? Don’t worry, we’re going to break it all down in a way that’s easy to understand and, dare I say, fun!
What Exactly Is Information?
In simple terms, information is processed, organized, or structured data that can be used to understand something or make a decision. Think of it this way: data is all those little puzzle pieces scattered on the table. Information is what you get when you put the pieces together to form a beautiful picture that actually makes sense.
Here’s an example: Imagine you’re handed a list of numbers: 55, 68, 72, 87, 43. By themselves, they’re just numbers – raw data, not all that useful. But if I tell you these are the scores students received on a math test, you now have context. And if I add that the passing grade is 50, you can assess which students passed and which didn’t. We’ve taken raw data and transformed it into actionable information.
Defining Features of Information
Ready for some pro tips? Here’s how you can recognize information:
- It’s Contextual: Information always provides meaning. Without context, it’s just a jumble of random facts.
- It’s Organized: Information has structure. It could take the form of tables, charts, or even sentences – but it creates order from disorder.
- It’s Useful: The ultimate purpose of information is to help you take steps, form strategies, or solve problems.
The Role of Information in Everyday Life
Information plays an enormous role in our daily routines and decision-making processes. For instance, think about reading a weather app. A temperature reading of 85 degrees Fahrenheit is just data. But once the app includes elements like humidity, wind speed, and a cheerful graphic that says, Sunny and warm great day for a picnic! it turns that data into useful information. It doesn’t just tell you the temperature; it tells you how to plan your day.
Another example? Look at an online bank statement. Seeing a list of transactions by itself isn’t always helpful: lots of numbers with no immediate meaning. But with categories like groceries, rent, and entertainment, you get an overview of your spending habits. That’s information you can use to better manage your finances!
Why Information Matters
Information is what helps us make informed decisions. Whether you’re crossing the street (is the traffic light green? or launching a new product (what do customer surveys say, it’s all about leveraging the right information at the right time.
As we rely more on technology and data-driven tools, understanding how to interpret and use information effectively is a must have skill. Remember: good decision-making starts with great information.
How Data Transforms into Information in Real-world Scenarios
Let’s dive into the fascinating journey of how raw pieces of data evolve into actionable insights we call information. At its core, this transformation is all about giving context, structure, and meaning to otherwise scattered bits of data. To make it relatable, let’s explore some everyday examples, breaking it down step-by-step in a way that’s both practical and easy to understand.
1. From Numbers to Meaningful Insights
Imagine you’re managing a fitness tracking app, and your raw data includes the number of steps users take each day. These numbers – say 5,000, 7,200, and 10,000 represent just data in isolation. They’re meaningless on their own until you ask the right questions, organize it, and connect the dots.
What transformation looks like:
- First, you add context by labeling each figure: Steps walked daily.
- Then, you calculate averages, trends, or compare numbers across days.
- Afterward, you translate findings into actionable insights: You’re meeting your daily goal 3 out of 7 days. Consider walking an extra 2,000 steps to hit your weekly target.
By synthesizing the data, it becomes something you (or app users) can understand and act on. That’s turning raw data into useful information!
2. Real-life Example from Weather Forecasting


In the world of weather, raw data might include metrics like temperature measurements, humidity levels, and wind speed readings from various sensors. For someone without a background in meteorology, this data might be overwhelming or meaningless. What turns this sea of numbers into helpful information is the process meteorologists follow.
Here’s what happens:
- First, they combine these individual pieces with geographical context: 75°F and 60% humidity in Seattle at 9 a.m.
- Then, they analyze trends and patterns: A cold front is moving southeast.
- Finally, they present actionable information: “It’s likely to rain tomorrow. Don’t forget your umbrella!”
Thanks to this transformation, instead of raw temperatures and wind speeds, you get advice you can actually use.
3. The Role of Technology: Transforming Customer Data in Business
Let’s hop into the world of retail. A store might collect raw data on customer purchases – individual items bought, times of purchase, or customer demographics. While these pieces on their own might be hard to interpret, analytics tools can work magic here.
Picture this:
- The store collects data: one customer buys bread, another buys milk, and a third buys bread and milk.
- By analyzing patterns in the data, the store identifies a trend: Customers often purchase bread and milk together on weekends.
- They use this information to take action: They bundle bread and milk with discounted pricing to boost weekend sales.
Now the business benefits because the raw customer data has been transformed into marketable insights that boost profits – a win-win scenario!
Key Differences Between Data and Information in Practical Terms
Let’s cut through the jargon and get straight to the point: data and information are not the same thing. Sure, they’re closely related, but trying to use these terms interchangeably is like confusing raw ingredients with a gourmet meal. So, what sets them apart Let’s break it down in practical, easy-to-understand terms.
1. Data Is Raw, Information Is Organized
Imagine you’re in a kitchen. You’ve got raw ingredients like eggs, flour, milk, and sugar. That’s your data. It’s unprocessed and doesn’t follow any structure that makes sense on its own. However, when you measure the right amounts, mix them properly, and bake them, you get a delicious cake — that’s your information. It’s the finished product that’s meaningful, purposeful, and ready to be consumed.
In technical terms, data is raw facts and figures numbers, dates, or measurements without context. Information, on the other hand, is that data refined, analyzed, and interpreted to provide value or insight.
2. The Role of Context
One of the biggest differences between data and information lies in how they’re used. Context is the glue that holds information together. Let me explain:
- Data: Imagine someone hands you a list of numbers like 65, 70, 75. On their own, these numbers are just… numbers. But what do they mean?
- Information: Add some context, like “temperatures recorded over three days in New York City,” and suddenly those numbers start to tell a story. Now they’re useful because you understand what they mean.
3. Data Is Quantity, Information Is Quality
Here’s another way to think about it data is about quantity, while information is all about quality. You can gather vast amounts of data, but if you don’t process or analyze it, it remains unhelpful. For example, a company might collect thousands of customer reviews. If those reviews are left unread in a database, that’s just data. But, when the company analyzes them to understand key trends say, most customers love their shipping speed but complain about customer service the company now has valuable information to act upon.
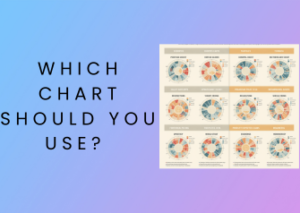
4. Presentation Matters
Another difference lies in the way data and information are presented. Let’s compare:
- Data: Raw data might be stored in a spreadsheet filled with rows upon rows of numbers and labels. It’s not visually appealing or easily digestible.
- Information: Take that same data and format it into a colorful graph or a concise report. Add insights or recommendations, and suddenly, it’s engaging and actionable.
It’s not just about what you have; it’s about how you use and share it!
5. Use Cases
To give you a concrete example: Imagine you’re a social media manager looking at post metrics for your brand. The data might include numbers like “2,500 likes,” “300 comments,” and “500 shares.” But it’s the information — such as “posts with short videos perform 45% better than image-only posts” — that helps you decide how to plan future content. Data gives you the building blocks, but information gives you a clear direction.
Examples That Simplify the Difference Between Data and Information
Sometimes, the best way to understand a concept is by exploring simple, real-world examples. When it comes to distinguishing data from information, it’s all about context, organization, and the value added through interpretation. Let’s break it down with relatable scenarios that hit home!
1. Weather Conditions: Numbers vs Insights
Imagine you open your weather app on a random morning. The app shows:
- Temperature: 32° Celsius
- Humidity: 70%
- Wind speed: 15 km/h
What you see here is data. It’s raw, unprocessed, and doesn’t provide immediate meaning on its own. Now, your app processes this data and prepares something meaningful: “It’s hot and humid today with moderate winds. Remember to stay hydrated if you’re stepping out!” See the difference? That’s information. The app has interpreted the data to provide actionable insights, helping you plan your day better.
2. Shopping Preferences: Receipts vs Market Trends


Let’s say a retail store collects data about customer purchases. A typical receipt might scahow:
- Purchased items: Bread, Milk, Eggs
- Total amount: $15.50
- Date: October 20
Individually, this is raw data – factual details about purchases. However, if the retailer compiles thousands of receipts and analyzes them, they might learn, “Bread, milk, and eggs are most frequently bought together on weekdays in the morning.” This insight becomes information, enabling the store to stock appropriately or offer tailored promotions. The transformation of receipts into trends is the essence of turning data into actionable information.
3. Social Media: Likes vs Engagement Patterns
On social media, let’s say a post you shared gets 150 likes, 30 comments, and 50 shares. These numbers are mere data. But once you analyze them to find patterns – such as “posts with bright images and funny captions generate 20% more shares” – you’ve transformed the data into information. This kind of insight helps you make smarter decisions, maybe leading you to post similar content in the future to maximize engagement.
4. Fitness Tracking: Steps vs Health Insights
If you use a fitness tracker, it might show:
- Steps taken: 10,000
- Calories burned: 400
- Heart rate: 78 bpm
This is raw data. But when your tracker interprets these numbers and tells you, “You’ve reached your daily fitness goal! Keep it up to maintain your health,” it’s now conveying information. The data gains purpose and becomes relevant to your fitness journey.
Why These Examples Are Important
Through these examples, it’s clear that information adds value to otherwise disconnected data points. The key takeaway? Data is just the starting point. It’s only when it’s contextualized, interpreted, and applied to a purpose that it transforms into information. This understanding is critical in daily life, not just for businesses or tech enthusiasts, but for anyone seeking to make informed decisions in a data-driven world.
Common Misunderstandings: Data as Information? Think Again
Let’s have a little heart-to-heart about something that often gets tangled up in everyday conversations – the confusion between data and information. Picture this: you’re in a meeting, someone blurts out, We need more data to make a decision! But do we really need more data? Or do we actually need information? It might seem like splitting hairs at first, but hang with me. Once we clear this up, you’ll never look at data and information in the same way again.
What’s the Common Misunderstanding?
Here’s the deal: people often use data and information interchangeably. That’s where the misunderstanding creeps in. To be fair, it’s easy to see why. After all, both terms are fundamental in making sense of the world around us. But here’s a simple way to think about it:
- Data: It’s raw, unprocessed, and doesn’t carry much meaning on its own. Think of it like a collection of random puzzle pieces – scattered but full of potential.
- Information: This is the puzzle all put together. It’s organized, makes sense, and delivers meaning that can drive action or decisions.
When people say they need more data, what they usually want is the synthesized meaning: patterns, insights, or trends in other words, information. And that’s where the misunderstanding becomes a problem. If you’re chasing raw data when actionable information is what’s needed, you’re just spinning your wheels.
Why Do We Confuse the Two?
This mix-up often happens because we now have access to overwhelming amounts of data, thanks to advances in technology. Social media metrics, website traffic figures, spreadsheets of sales transactions these all look important at first glance. Here’s the kicker, though: just having a pile of numbers doesn’t mean you know what action to take. It’s like knowing how many calories are in a meal but not understanding if it fits into your nutritional goals.
Another reason we fuse the two concepts is that data becomes information, so the line between them can appear blurry. But remember: the transformation isn’t automatic. Without processing, context, or analysis, data stays inert, just noise in the system.
How Can You Avoid Falling into the Trap?
Alright, enough about the problem – let’s talk solutions! Here’s how to stop equating data with information in practical, actionable ways:
- Start with a Question: Before collecting or looking at data, ask, “What am I trying to understand or solve?” Let your question guide you to the type of information you need.
- Focus on Patterns, Not Points: Don’t get lost in scattered data points. Instead, look for trends, groupings, or anomalies. That’s where the information lies.
- Context Is Key: Data only becomes meaningful when you add context. For instance, “100” doesn’t mean much until you know it’s “100 new customers in the past month.” Make context your best friend.
- Invest in the Right Tools: Visualization tools, dashboards, and analysis frameworks can bridge the gap, turning data into actionable insights.
Why Both Data and Information Matter in Business Decisions
When it comes to making informed business decisions, data and information are an unbeatable duo—but they’re far from interchangeable. Each plays a unique role in steering companies toward success. Let’s unpack why both are equally critical in the world of commerce, and more importantly, how you can use them effectively to thrive in your business ventures.
The Role of Data: The Foundation of Decision-Making
Think of data as the raw ingredient in a recipe. On its own, it’s not particularly useful. Numbers in a spreadsheet, website traffic counts, customer demographics—these are just unprocessed facts. By themselves, they don’t tell a story. And let’s be honest, who has the time or energy to sift through piles of raw numbers?
In essence, data serves as the foundation. It’s what you analyze and interpret to gain a better understanding of your business. For instance, knowing that 20,000 people visited your website last month is valuable—this is raw data. But what’s it actually telling you? For that, you need information.
Where Information Comes in: Bringing Meaning to the Data
This is where the magic happens! Information takes raw data and organizes it into something meaningful, something actionable. For example, if you know that half of those 20,000 visitors abandoned their carts before checking out, you’re no longer just staring at numbers. You’re seeing a story unfold—one that you can act on. That’s the power of information in decision-making.
Information gives context and insights that help you understand the why behind the numbers. Instead of just observing that sales dipped last quarter, information might reveal this was due to delayed product delivery times, allowing you to fix the underlying issue.
Why You Need Both for Smarter Business Choices
If data is the gears and screws of a business engine, then information is the blueprint that shows how everything fits together. Alone, data can be overwhelming. Meanwhile, without fresh, accurate data, the information you generate may be outdated or even misleading. Together, they create a system that’s as powerful as it is reliable.
- Data ensures accuracy: Robust data collection offers you a trustworthy starting base for analysis.
- Information drives strategy: Converting data into information allows you to identify trends and opportunities, whether it’s entering new markets or improving customer retention.
- Both fuel innovation: A mix of solid data and insightful information helps businesses stay competitive and find creative solutions to their challenges.
Practical Advice for Businesses
How can you harness the power of both data and information for your decision-making?
- Invest in reliable tools: Analytics tools like Google Analytics or Power BI help transform raw data into meaningful visualizations and insights.
- Educate your team: Knowing how to interpret both data and information empowers every department, from marketing to operations, to align with company goals.
- Review regularly: Trends and insights can change quickly. Regularly analyzing and updating your data ensures your decisions stay relevant.