OK, let’s start with the basics: what exactly is ‘n’? You’ve probably seen it pop up in research papers, surveys, and reports, tagged alongside big conclusions. ‘n’ refers to the sample size, or the number of observations, individuals, or data points included in a study. Simply put, ‘n’ is the backbone of data sampling.
Imagine you’re baking cookies (who doesn’t like cookies, right?) you taste one to check texture, sweetness, or that perfect chocolate-to-dough balance. That cookie acts as your “sample.” It represents the batch as a whole, and through it, you’re trying to draw a more general conclusion. In statistics and data analysis, sampling works similarly it allows us to analyze a smaller group (the sample) and draw insights about the larger population it represents.
But here’s the catch: determining how many cookies you need to taste or how big your sample size (‘n’) should be isn’t as simple as just picking a random number. If your sample size is too small, it may not capture the diversity of ingredients (or opinions, data trends, etc.) in the entire batch. Conversely, tasting too many cookies might be overkill (and probably a shortcut to a sugar crash).
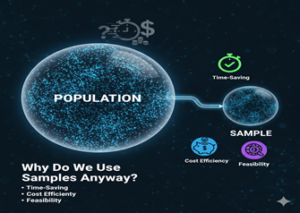
Why Do We Use Samples Anyway?
In a perfect world, we’d analyze every single data point in populations to guarantee 100% accuracy. But the real world is a little messier. Populations can be incredibly large think of all the students in a city’s schools or every customer at a global e-commerce platform. Studying everyone is time-consuming, expensive, and sometimes just downright impossible (or at least impractical).
- Time-Saving: Sampling avoids the need to evaluate overwhelming amounts of data.
- Cost Efficiency: Fewer resources are needed to collect and analyze smaller samples.
- Feasibility: Certain populations (like past events, rare diseases, or hard-to-reach demographics) can only be studied effectively through sampling.

‘n’ in Action: Big Decisions from Small Data
Let’s not underestimate the power of ‘n’ it shapes decisions in industries ranging from healthcare to technology. For example:
- In political polling, ‘n’ represents the citizens surveyed to predict election outcomes.
- For pharmaceutical studies, it’s the group of people testing a new medication.
- Marketers use ‘n’ in customer focus groups to gauge product success before a full launch.
And here’s what’s exciting: if chosen correctly, a relatively small, well-selected sample can give us accurate, actionable insights about a massive population!
The Ripple Effect: How Sample Size Impacts Results
Hello there! Let’s dive into the fascinating world of sample size and its ripple effects. Trust me, this isn’t just a “stats class flashback” — it’s the cornerstone of reliable data analysis and decision-making. So why does the size of your sample, lovingly referred to as “n,” matter so much? Let’s break it down.
The Butterfly Effect of Sample Size
Think of sample size as a pebble you throw into a pond. The size of that pebble influences the ripples it creates. In data analysis, those ripples represent the accuracy, validity, and reliability of your results. A small pebble might produce barely-noticeable ripples (i.e., unstable results), whereas a larger, well-balanced one creates stronger, clearer patterns. The right-sized “pebble,” or sample, ensures that you can trust your conclusions and who doesn’t love feeling confident about their data?
Why Sample Size Influences Accuracy
First things first: bigger isn’t automatically better. But too small? That’s a statistical nightmare. When your sample size is tiny:
- Your data might exaggerate trends that don’t actually exist.
- You’re more likely to pick up “noise” rather than meaningful patterns (yikes!).
- Your conclusions could be flat-out wrong because you didn’t measure enough people, animals, widgets, or whatever you’re studying.
For example, imagine flipping a coin just five times. You might get 4 heads and 1 tail and wrongly conclude the coin is biased. But flip the same coin 500 times, and you’ll see the odds even out closer to 50/50. That’s the power of larger sample sizes: they iron out quirks and randomness.
Confidence Levels and Margins of Error
Let’s talk about two key concepts that tightrope-walk alongside your sample size: confidence levels and margins of error. In simple terms:
- Confidence level: How sure are you? A 95% confidence level means you’re 95% sure your results reflect the true population.
- Margin of error: The wiggle room in your results. A smaller margin of error is ideal.
To reduce your margin of error and increase confidence, you need a sufficiently large sample size. If your sample is too small, your margins grow, and your confidence shrinks faster than ice cream in summer heat. Not a good combo!
The Danger of Overgeneralization
Ever hear sweeping conclusions like “85% of people love chocolate” and silently wonder, “Who are these people, and where are they hiding?” That’s what happens when sample sizes are too narrow or don’t capture enough diversity from the population. A small sample can’t possibly represent the experiences or opinions of a larger group accurately. Remember: small sample, limited story.
Striking the Perfect Balance
While a larger sample size reduces uncertainty, there’s a sweet spot. Over-sampling wastes time and resources, while under-sampling jeopardizes your conclusions. The ripple effect of sample size is about balance. Find your Goldilocks zone — not too small, not too extravagant — and your data results will shine.
Small Samples, Big Risks: Common Pitfalls to Avoid
Imagine trying to figure out the flavor of a soup by tasting just one spoonful. While it might help you guess, it could also lead you to completely miss out on the nuances of the dish. This is exactly what happens when we rely on small sample sizes in data analysis: we risk making flawed conclusions that don’t truly reflect the bigger picture. Here’s why small samples can be so risky and how to avoid these pitfalls.
Why Small Samples Aren’t Always Reliable
The issue with small samples comes down to representation. Statistical analysis works best when we have a group of data points (or participants) that represent the larger population we’re studying. With a small sample size, there’s a much higher chance of including outliers or anomalies that skew the results, or simply failing to capture key patterns. This can lead to decisions based on random noise rather than meaningful trends.
For example, say you’re conducting a survey on people’s favorite ice cream flavors. If your sample only includes 10 people, and 6 of them happen to love pistachio, you might mistakenly conclude that pistachio is the most popular flavor. In reality, a larger sample would likely bring a more balanced distribution that reveals chocolate or vanilla as the true crowd favorites. Small samples exaggerate extremes—they make “rare” seem “common.”
Key Risks That Come with Small Sample Sizes
- Overestimating Significance: A small sample can lead to conclusions that seem far more impactful than they actually are. Relationships between variables might appear stronger than they are in the full population.
- Higher Variability: Smaller samples typically have greater variance, meaning results are less stable. If you repeated the same analysis with a different small sample, you might end up with completely different conclusions.
- Limited Generalizability: Findings based on small samples might not apply to the wider audience or population you care about. This can be particularly concerning in areas like medical research or public policy, where decisions affect real lives.
- Increased Margin of Error: When the sample size is small, the margin of error grows, meaning you’re less likely to land close to the true population value. This creates shaky data that can confuse rather than clarify.
How to Avoid Small Sample Pitfalls
So, what can you do to ensure your results are trustworthy and meaningful? Here are a few pointers:
- Plan Ahead: Before starting your analysis, determine the ideal sample size using tools like a sample size calculator. These tools consider factors like variability and desired confidence levels.
- Aim for Diversity: Make sure your sample includes a variety of participants or data points. This helps you capture a broader spectrum of the population and reduces bias.
- Repeat Whenever Possible: If you’re working with a limited sample size, try running the analysis multiple times on different small samples. If the results are stable across trials, they’ll carry more weight.
- Acknowledge Your Limits: Be transparent about the size of your sample when presenting your findings. Note any potential biases or limitations, and avoid drawing broad conclusions.
Bigger Isn’t Always Better: The Balance Between Quantity and Relevance
When it comes to sample sizes in data analysis, there’s a common misconception that “the bigger, the better” is the golden rule. Sure, having a robust sample size can help improve statistical power and accuracy, but relying solely on size without considering quality and relevance is like trying to fill a bucket with water when it has a hole at the bottom it might look full at first, but the real value could leak away. Let’s dig deeper into this idea and explore why a balanced approach is so critical.

The Temptation of Large Sample Sizes
It’s easy to see why people equate larger sample sizes with better results. Bigger numbers mean more data points, which translates to more observations, right? This can refine the precision of your calculations, particularly when you’re looking at averages, proportions, or trends. But here’s the catch: bigger datasets don’t automatically mean better analysis. If your data lacks relevance or includes too much noise, your analysis can actually suffer.
Imagine a scenario where you’re surveying customer satisfaction at a local coffee shop. If you cast a very wide net and survey every coffee drinker in the city, how many of those responses are really reflective of your coffee shop experience? While the sample might be large, it could be full of people whose input isn’t relevant to your specific question.
Relevance Trumps Raw Volume
Here’s a handy rule of thumb: data quality matters as much as, if not more than, data quantity. A small, well-chosen sample that directly represents your target audience will often yield more reliable insights than a massive, random dataset full of irrelevant information.
When collecting data, ask yourself the following:
- Does this sample represent the population or group I’m studying?
- Am I gathering data from individuals who genuinely relate to the research question?
- Is my focus on adding more responses, or on learning something useful from the data I already have?
By narrowing the focus on relevance, you reduce noise and eliminate unnecessary complexity in your analysis.
The Downsides of Oversized Datasets
Too much data can be just as problematic as too little it’s what statisticians sometimes refer to as the “curse of dimensionality.” Large datasets often come with complications:
- Data Overload: With massive datasets, finding meaningful patterns can feel like searching for a needle in a haystack. There’s just too much information to sift through.
- Noisy Data: A larger sample size can include outliers or irrelevant data points that distort your findings.
- Waste of Resources: Collecting and processing large datasets can be expensive and time-consuming. If most of it doesn’t add value, those resources are effectively wasted.
Big data might be trendy, but it doesn’t mean you need to chase sky-high sample sizes for every analysis. Often, simpler is better.
Striking the Right Balance
The key takeaway here is to focus on getting a sample size that’s appropriate to your study rather than fixating on sheer numbers. To do this effectively:
- Start by clearly defining your population and research goals.
- Use statistical tools or software to calculate the minimum sample size you need for confident results.
- Prioritize accuracy and representation over raw volume.
By doing so, you’ll not only optimize your resources but also ensure your results are both meaningful and actionable.
Real-World Applications: Examples of ‘n’ in Everyday Data Studies
Let’s face it: when we hear the term “sample size” (often referred to as ‘n’), it can sound like something plucked straight out of a statistics textbook. But here’s the thing: ‘n’ isn’t just academic jargon; it’s a vital concept woven into the fabric of our everyday lives. From health studies influencing the medications we take to consumer polling shaping the next gadget release, real-world examples of ‘n’ are all around us. Let’s dive into a few real-life scenarios where sample size makes a world of difference.
1. Healthcare Studies: Testing Treatments That Save Lives
Perhaps one of the most crucial areas where sample size matters is in healthcare and medicine. Imagine researchers are testing a new lifesaving drug. A small sample say, just 10 patients—likely won’t give enough reliable data about how the drug performs across diverse populations. How can we know its effectiveness across different ages, genders, or health conditions with such a small pool?
For instance, if a study involves 10,000 participants instead of 10, researchers can identify side effects across various demographics, ensuring the drug is safe and effective for most people. Yet, even in this example, there’s a balance: too large a sample could waste resources, cost time, and delay results, while too small might jeopardize the accuracy. See how the right ‘n’ plays the hero in improving lives?
2. Election Polls: Predicting the Nation’s Decisions
Another familiar example? Election polling. Whether it’s a local mayoral race or a heated presidential election, accurately gauging public opinion depends heavily on the sample size. Suppose a poll only collects responses from a group of 200 voters in one city. That data paints only a very narrow picture!
Pollsters aim for a sample size that’s representative of the broader population. This involves not just numbers but also diversity in geography, age, economic background, and more. A nationally representative poll typically surveys around 1,000-1,500 people—a number that, through statistical modeling, can reflect the views of millions. I know statistics work like magic sometimes!
3. Marketing and Product Feedback: Making or Breaking a Brand
Ever notice those pop-up surveys asking for feedback about your online shopping experience? Brands and businesses thrive on data collected from customer surveys, and the size of their sample pool can make or break their insights.
For instance, if a company launches a new flavor of a popular drink and gets feedback from only 50 people, that’s probably not enough to decide whether to roll that product out nationwide. But if they gather feedback from 10,000 taste-testers across various regions, they’ll have much more confidence in their decision.
4. Environmental Studies: Monitoring Planetary Changes
Scientists studying climate change often rely on numerous collected samples think of air quality readings, ocean temperature data, or wildlife population counts. Why? Because ecosystems are vast and complex. A single data point or too few locations can’t give the full story.
For example, researchers monitoring pollution levels across a river basin won’t stop at one or two sample locations. They know that results from across multiple points—often dozens or hundreds are essential for creating dependable conclusions. That’s how they determine solutions that protect the environment.
5. Sports Stats: The ‘n’ Behind Your Favorite Team’s Wins
Even sports rely heavily on sample size! Analysts often look at data like batting averages, win-loss ratios, or points scored over dozens (or hundreds) of games before making predictions. No championship team was crowned based on one match performance—sample size ensures conclusions are rooted in consistent patterns rather than one-off events.
Calculating Sample Sizes: Methods That Work Without Overcomplication
Calculating the right sample size can feel like a daunting task, especially for those who don’t specialize in statistics. But don’t worry—this process doesn’t have to be overly complex. Let’s break it down into simple, digestible steps that will empower you to work smarter, not harder, when determining the perfect ‘n’ for your study.
Why Does Calculating the Right Sample Size Matter?
Picture this: You’ve spent hours collecting data, analyzed it thoroughly, and presented results that seem spot-on. But then, someone asks about your sample size, and you don’t have a solid answer. Uh-oh. Having an appropriate sample size ensures that your data represents the population well enough to be meaningful and avoids scenarios that might render your findings questionable, or worse, invalid.
If your sample is too small, there’s a high risk that your results could be skewed due to random chance. On the flip side, an unnecessarily large sample could mean wasted time, effort, and resources. The key is striking that sweet spot between precision and efficiency. So, how exactly do we get there?
Key Factors to Consider
Before diving into the numbers, it’s crucial to account for a few key variables that influence the sample size you’ll need:
- Population Size: How big is the group you’re studying? If the total population is small, you might not need a huge sample.
- Margin of Error: What level of error are you comfortable accepting? A smaller margin of error (e.g., 2%) means you’ll generally need a bigger sample.
- Confidence Level: You’ll often see this expressed as percentages like 90%, 95%, or 99%. A higher confidence level reflects more certainty in your results but usually requires more data.
- Variability: If you expect widely varying responses in your population, that variability increases the sample size you’ll need to make sure your results are reliable.
Methods That Keep It Simple
Let’s walk through some tried-and-tested methods to calculate sample sizes without overloading your brain:
- Use a Sample Size Calculator: Many free calculators, like those found online, allow you to plug in basic inputs (population size, confidence level, margin of error) to instantly determine your required sample size. Simple and effective!
- The 10% Rule: A quick heuristic is to sample at least 10% of your population, up to about 1,000 individuals. While not a one-size-fits-all rule, it’s a solid starting point for many informal studies.
- Know the Magic Numbers: In some cases, researchers rely on common benchmarks. For example, 30 observations are often sufficient for basic statistical tests like means and correlations.
- Leverage Statistical Formulas: If you’re feeling brave, you can use loose variations of the formula for sample size (n = (Z² × p × (1-p)) / e²), where Z represents your desired confidence level, p is the proportion of variability in the population, and e is your margin of error. It sounds intimidating, but trust me, it’s easier than it looks!
When Sample Size Goes Wrong: Lessons from Historical Missteps
Data analysis is the engine that drives countless decisions in science, business, and policy. Yet, even the most sophisticated analysis can crumble if the foundation a.k.a. the sample size has cracks. When sample size goes wrong, the consequences can be surprising, expensive, and often damaging. Let’s take a friendly look at what happens when ‘n’ misses the mark and the lessons we can learn from such missteps.
Famous Case Studies That Showcase the Danger
Learning from past mistakes is smarter (and less painful) than making your own. Let’s explore real examples of where a poorly chosen sample size steered results off course:
- The 1936 Literary Digest Poll: One of the most infamous cases in polling history, this disaster resulted from a flawed sample that was too large but wildly unrepresentative. The magazine predicted a landslide victory for Alf Landon in the U.S. presidential election. Franklin D. Roosevelt won instead. Why? They surveyed 2.4 million people—an undeniably large sample, but it leaned heavily toward affluent individuals, leaving out large swaths of the electorate. Bigger doesn’t always mean better!
- Medical Trials with Insufficient Participants: In the field of medicine, underestimating the required sample size can lead to devastating consequences. For instance, early drug tests that enrolled too few participants often missed critical side effects or failed to prove efficacy, leading to subsequent harm when the drugs hit the market.
- Tech Product Testing Fails: Tech companies launching products based on user testing often run into trouble by testing features with a sample size that is too small or too narrowly focused. Remember the backlash against facial recognition software? Much of it came down to initial development using data that prioritized certain skin tones over others, creating real-world discrimination issues. Yikes.
So, where does this leave us? It shows that not only the size but the nature of your sample matters. Representation, diversity, and scope all play a role in avoiding these pitfalls.
Why It Happens: Common Misjudgments with Sample Size
Missteps often arise from well-meaning but flawed reasoning. Here are some common pitfalls to watch out for:
- Overconfidence in Small Numbers: People frequently rely on small sample sizes due to time or budget constraints, but this can backfire when variability in the data isn’t accounted for. A small sample might show a trend purely by chance, leading to false conclusions.
- Overlooking Population Diversity: A poorly designed study can include enough participants but fail to represent the relevant demographics, leading to skewed results.
- Skipping Sample Size Calculations: Too often, people rely on guesswork to decide how many samples to collect. Proper calculations, based on statistical power, confidence levels, and effect size, can prevent costly errors.
- Misinterpreting Early Findings: Sometimes, early promising results tempt researchers to cut studies short. Without completing the required sample size, findings can be incomplete or even misleading.
Lessons to Take Forward
If history has taught us anything, it’s that taking shortcuts with sample sizes can lead to big regrets. So, here’s your takeaway:
- Painstakingly ensure that your sample size is not just “big enough” but also representative of the population you’re studying.
- Use tools and methodologies to properly calculate the size you need—don’t just eyeball it. Consult statisticians or use free online calculators!
- Never underestimate the importance of diversity in your sample to avoid biases.
At the end of the day, careful planning goes a long way. After all, data analysis is only as strong as the design choices you make in the initial stages. So next time you think about ‘n,’ remember these lessons and approach your work with purpose and precision


