Performance analytics is the practice of measuring how effectively a business, team, process, or system achieves its goals using defined metrics and key performance indicators (KPIs). Instead of analyzing raw data in isolation, it evaluates results in context to determine whether outcomes meet expectations or fall short.
Organizations use performance analytics to track progress, reduce guesswork, and make informed, data-driven decisions. It is widely applied across marketing, sales, operations, human resources, and finance to monitor performance, optimize processes, and improve overall efficiency.
What Is Performance Analytics?
Simple Definition
Performance analytics is a structured approach to measuring outcomes against predefined goals using metrics and KPIs. It focuses on evaluating effectiveness, identifying performance gaps, and determining whether actions, processes, or strategies deliver the expected results.
Unlike basic data analysis, performance analytics adds context and purpose by linking measured results directly to objectives and benchmarks.
What Question Does Performance Analytics Answer?
At its core, performance analytics answers one fundamental question:
“Is what we are doing working as intended?”
It evaluates performance by comparing actual outcomes with targets, helping organizations understand what is working, what is not, and where improvements are needed. This clarity enables teams to move from observation to informed action.
Why Performance Analytics Matters
Performance analytics helps organizations move beyond raw data by focusing on measurable outcomes and goal achievement. It matters because it:
Connects data directly to business objectives and performance targets
Enables real-time tracking of progress across teams, processes, and systems
Reduces guesswork by replacing assumptions with measurable insights
Identifies inefficiencies, bottlenecks, and underperforming areas early
Organizations using performance analytics adapt faster and make measurable improvements by continuously aligning actions with results.
Who Uses Performance Analytics?
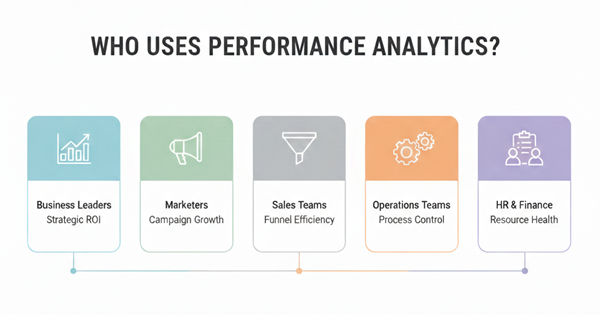
Performance analytics is used across different roles and departments, each with a specific goal in mind. While the metrics may vary, the objective remains the same: measure outcomes against targets and improve results through data-driven decisions.
1. Business Leaders
Business leaders use performance analytics to evaluate strategic alignment and return on investment (ROI). It helps them track whether business initiatives are delivering measurable value and understand overall business performance analytics across departments. It also helps them to compare actual outcomes with strategic goals, and decide where to invest, scale, or adjust priorities.
2. Marketers
Marketers rely on performance analytics to measure campaign and channel performance. It enables them to track conversions, engagement, acquisition costs, and ROI across channels, helping identify which campaigns drive results and which require optimization.
3. Sales Teams
Sales teams use performance analytics to evaluate funnel efficiency and revenue performance. By analyzing lead movement, conversion rates, and deal outcomes, sales teams can identify bottlenecks, improve closing efficiency, and align efforts with revenue targets.
4. Operations Teams
Operations teams apply performance analytics to monitor process efficiency and cost control. It helps them track cycle times, resource utilization, error rates, and operational costs, enabling continuous improvement in productivity and reliability.
5. HR and Finance Teams
HR teams use performance analytics to measure productivity, workforce performance, and retention trends, supporting fair evaluations and workforce planning.
For a deeper understanding of how organizations measure employee productivity and efficiency, see Workforce Performance Analytics.
Finance teams use financial performance analytics to track financial performance, budget efficiency, and forecast accuracy, ensuring financial control and informed decision-making.
Across all roles, performance analytics provides clarity, accountability, and actionable insight, ensuring that daily activities contribute directly to organizational goals.
Performance Analytics vs Related Analytics Types
Performance analytics is often confused with other analytics disciplines because all of them work with data. However, each type of analytics serves a distinct purpose and supports decision-making at different levels. Understanding these differences helps organizations apply the right approach in the right context.
Performance Analytics vs Data Analytics
Data analytics focuses on examining raw data to identify patterns, trends, and relationships. Its primary goal is to understand what happened and why it happened within a dataset. If you want a deeper comparison of how these two approaches differ, see our detailed guide on Performance Analytics vs Data Analytics.
Performance analytics builds on data analytics by adding context and intent. Instead of exploring data in isolation, it evaluates outcomes against predefined goals and benchmarks. While data analytics may reveal traffic growth or usage trends, performance analytics determines whether those trends contribute to meaningful results such as efficiency, revenue, or goal achievement.
Performance Analytics vs Business Analytics
Business analytics is centered on supporting strategic decision-making. It analyzes data related to markets, finance, operations, and strategy to guide long-term business direction.
Performance analytics is more execution-focused. It measures how well strategies, initiatives, or teams are performing once decisions have been made. In simple terms, business analytics helps decide what direction to take, while performance analytics evaluates how effectively that direction is being executed.
Performance Analytics vs Operational Analytics
Operational analytics focuses on monitoring day-to-day activities and real-time processes. It helps teams track immediate performance indicators such as system uptime, process speed, or daily productivity.
For example, application performance analytics is widely used to monitor software response time, system stability, and real-time technical performance across digital platforms.
Performance analytics goes beyond daily monitoring by assessing whether operational activities contribute to broader objectives. While operational analytics shows what is happening right now, performance analytics determines whether those activities lead to desired outcomes over time.
Summary Comparison
| Analytics Type | Focus | Purpose |
|---|---|---|
| Data Analytics | Patterns and trends | Understand what happened |
| Business Analytics | Strategy | Guide decisions |
| Operational Analytics | Daily operations | Monitor execution |
| Performance Analytics | Outcomes and goals | Measure effectiveness |
By clearly distinguishing these analytics types, organizations can apply performance analytics more effectively and ensure it complements data, business, and operational analytics rather than overlapping with them.
Key Components of Performance Analytics
Performance analytics works effectively only when its core components are clearly defined and properly aligned.
These components ensure that performance is measured accurately, interpreted correctly, and improved continuously. Together, they form a structured framework for evaluating results against goals.
Data Sources
Data sources are the foundation of performance analytics. They provide the raw information needed to measure outcomes and evaluate progress.
These sources can be internal or external, depending on the area being analyzed.
Common data sources include:
- Website and application data
- Marketing and advertising platforms
- Sales and CRM systems
- Customer support and feedback tools
- Operational and financial systems
The quality and relevance of data sources directly affect the reliability of performance analytics. Accurate, consistent, and timely data is essential for meaningful performance measurement.
Metrics and KPIs
Metrics are measurable values that track specific activities or results, while Key Performance Indicators (KPIs) are the most important metrics aligned with defined objectives.
In performance analytics:
- Metrics provide detailed performance signals
- KPIs represent critical success indicators
Effective KPIs are clearly defined, measurable, and directly tied to business goals. Selecting the right KPIs ensures that performance analytics focuses on outcomes that truly matter rather than surface-level numbers.
Benchmarks and Targets
Benchmarks and targets provide context to performance data. Without them, it is difficult to determine whether performance is good, average, or below expectations.
- Benchmarks compare performance against historical data, industry standards, or competitors
- Targets define the desired level of performance within a specific timeframe
These reference points help organizations assess progress objectively and set realistic expectations for improvement.
Dashboards and Reports
Dashboards and reports are tools used to visualize and communicate performance insights. They transform complex data into clear, understandable formats that support decision-making.
Dashboards typically provide:
- Real-time or periodic performance snapshots
- Visual representations of KPIs and trends
- Easy access to critical performance data
Reports, on the other hand, offer deeper analysis, summaries, and explanations of performance outcomes. Together, dashboards and reports ensure transparency and accessibility across teams and stakeholders.
Feedback Loops for Optimization
Feedback loops enable continuous improvement by connecting performance insights to action. They ensure that findings from performance analytics are not static but lead to meaningful changes.
A strong feedback loop involves:
- Reviewing performance results
- Identifying gaps or improvement areas
- Implementing corrective actions
- Measuring the impact of those changes
This iterative process allows organizations to adapt quickly, refine strategies, and improve performance over time.
Data sources, metrics, benchmarks, dashboards, and feedback loops work together to create a complete performance analytics system. When these components are aligned, performance analytics becomes a powerful tool for measuring effectiveness and driving continuous improvement.
Performance Metrics and KPIs Explained
Performance metrics and KPIs are the backbone of performance analytics. They define what is measured, how success is evaluated, and where improvements are needed.
Choosing the right metrics ensures that performance analytics delivers meaningful insights rather than misleading numbers.
What Makes a Good Performance Metric
A good performance metric clearly reflects progress toward a specific objective. It should provide accurate, actionable, and relevant information that supports decision-making.
Effective performance metrics are:
- Goal-aligned – directly connected to defined objectives
- Measurable – based on clear and reliable data
- Actionable – capable of driving improvement actions
- Consistent – measured the same way over time
- Easy to understand – accessible to all stakeholders
Metrics that lack clarity or relevance often create confusion and lead to poor decisions.
Leading vs Lagging Indicators
Performance metrics can be classified as leading or lagging indicators based on what they measure.
- Leading indicators predict future performance. They signal whether current actions are likely to produce desired outcomes.
Examples include engagement rates, lead quality scores, or process completion rates. - Lagging indicators measure results after outcomes have occurred. They confirm whether goals have been achieved.
Examples include revenue, profit margins, customer retention, or conversion rates.
A strong performance analytics framework uses both types. Leading indicators help guide proactive action, while lagging indicators validate results.
Quantitative vs Qualitative KPIs
KPIs can also be categorized based on the type of data they use.
- Quantitative KPIs are numeric and measurable. They focus on measurable outputs such as sales volume, response time, or error rates.
- Qualitative KPIs capture perceptions, experiences, or quality-based outcomes. These include customer satisfaction, feedback sentiment, or service quality assessments.
Combining quantitative and qualitative KPIs provides a more complete view of performance, balancing measurable results with user or customer experience.
Common KPI Mistakes to Avoid
Despite their importance, KPIs are often misused. Common mistakes reduce the effectiveness of performance analytics and lead to poor insights.
Some common KPI pitfalls include:
- Tracking too many KPIs at once
- Using metrics that are not linked to goals
- Focusing on vanity metrics instead of meaningful outcomes
- Ignoring context such as benchmarks or timeframes
- Failing to review and update KPIs regularly
Avoiding these mistakes ensures that KPIs remain relevant, focused, and aligned with performance objectives.
Well-defined performance metrics and KPIs provide clarity, direction, and accountability. When chosen correctly, they transform performance analytics into a practical tool for evaluating success and driving continuous improvement.