Data is everywhere today, flowing in from apps, devices, websites, stores, and even sensors around us. But raw data alone doesn’t create value. The real power lies in uncovering the hidden patterns, trends, and relationships that help us make smarter decisions. That’s where data mining steps in. It breaks down massive datasets and turns them into meaningful insights you can actually use.
From grouping similar items, spotting unusual events, predicting what happens next, or understanding how data behaves over time, each technique brings its own way of making sense of information. In the sections below, you’ll explore some of the most important methods used in data mining, like clustering, association rules, classification, predictive modeling, outlier detection, and sequential mining.
Whether you’re a student, a business owner, or someone curious about how data quietly powers decisions in the world around you, these concepts will help you see how valuable and fascinating data mining can be. Let’s get started and break it all down in a simple, practical way!
Patterns in Data: Finding Insights Hidden in Clusters
Data mining might sound like an intimidating term, but it’s really just about digging through massive amounts of information to discover interesting and useful patterns. Let’s dive into one of the key types of data mining: pattern discovery. Specifically, clustering is an exciting and widely-used method to uncover hidden insights within data. Intrigued yet? Let’s make sense of it together!
What is Clustering?
Imagine you’re staring at a huge pile of data points. There’s nothing obvious connecting them at first glance, they’re just dots scattered across a graph. Clustering is like grouping those dots into meaningful clusters based on how similar or close they are to one another. These groups (or “clusters”) give us incredible insights into trends, relationships, or behaviors within the data.
A classic example is segmenting customers for a business. By clustering customers based on their habits, preferences, or locations, businesses can personalize outreach or create more targeted marketing strategies. Cool, right?
How Clustering Works
Clustering relies on mathematical algorithms to figure out which data points belong together. Some of the most popular clustering techniques include:
- K-Means Clustering: This is one of the simplest and most commonly used clustering methods. You decide how many clusters you expect in advance (hence the “k”), and the algorithm works to split the data into that many distinct groups.
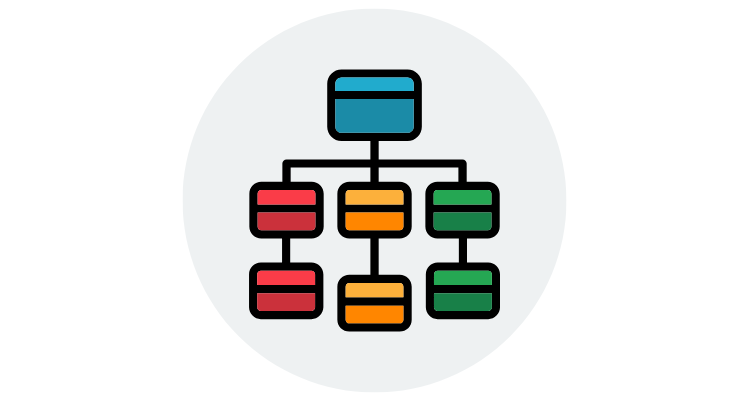
- Hierarchical Clustering: Unlike k-means, this method builds a tree-like structure where clusters merge or split as levels of similarity change. It’s particularly helpful when you’re not exactly sure how many clusters you need.
- Density-Based Clustering: Techniques like DBSCAN (Density-Based Spatial Clustering of Applications with Noise) focus on grouping dense areas of data, while leaving outliers in the dust, perfect for identifying noise in messy datasets.
Why Patterns in Clustering Matter
Patterns are powerful. They allow you to make informed decisions and uncover actionable insights. Take healthcare as an example. Using clustering, medical professionals can categorize patients into groups based on shared symptoms or conditions. This helps in diagnosing illnesses, tailoring treatments, and improving health outcomes overall.
Or think about customer reviews online. Businesses can cluster product feedback to understand what people love, what needs improvement, or even pick up on emerging trends to stay ahead of the curve. The ability to identify natural, meaningful boundaries within data? That’s a game-changer!
Expert Tips for Better Clustering
If you’re interested in using clustering techniques, here are a few top tips to maximize success:
- Start small: Begin with a subset of your data. Trying to cluster massive datasets without understanding their nuances can lead to confusion.
- Scale your data: Algorithms like k-means can be sensitive to feature scaling. Standardizing or normalizing your data can have a huge impact on accuracy.
- Visualize the results: Use scatter plots or dimensionality reduction tools (like PCA) to make sense of clusters. Seeing the data’s shape and structure can help validate your findings.
Clustering may seem complex at first, but the ways it reveals meaningful groups hidden in our data is nothing short of fascinating. Whether you’re improving customer experience, diagnosing patient groups, or analyzing social trends, patterns in data have the power to unlock transformative insights. So, don’t be shy—go ahead, roll up your sleeves, and start digging into those clusters. There’s gold in your data just waiting to be found!
Recognizing Relationships: Association Rule Techniques Explained
Have you ever wondered how grocery stores seem to know just the right combination of products to place next to each other? That’s no accident, it’s the magic of Association Rule Techniques at work! This data mining strategy is all about discovering relationships between items in large data sets. Let’s dive in and uncover how these techniques actually work and their real-world applications.
What Are Association Rules?
At its core, association rule mining is like finding hidden connections within your data. It identifies patterns that occur frequently together. For instance, if we analyze your shopping habits, we might discover that people who buy bread often purchase butter too. This relationship (called a rule) can be represented as:
If someone buys bread, they are likely to buy butter.
These insights are expressed in terms of support, confidence, and lift, which help evaluate the strength and reliability of associations. Don’t worry if these sound technical, I’ve got your back!
Breaking Down Key Metrics
- Support: This tells us how often a particular combination of items occurs in the data. For example, if 20 out of 100 transactions include both bread and butter, the support is 20%.
- Confidence: This measures how likely one item is to appear when another is present. If every shopper who buys bread also buys butter, the confidence is 100%.
- Lift: This digs deeper, assessing whether the combination of items occurs more often than random chance would suggest. A lift greater than 1 implies a meaningful relationship.
How Do We Use These Rules?
The beauty of association rules lies in their versatility and practicality. These insights pop up everywhere, from business strategy to user experience design. Here are some examples:
- Retail Optimization: Stores arrange shelves to maximize sales. Finding that chips and soda are frequently purchased together? Time to make them neighbors on the shelf!
- Recommender Systems: Online platforms, like Netflix or Amazon, use association rules to suggest personalized picks. Think: “Customers who bought this also bought…”
- Market Basket Analysis: Businesses analyze which items sell together. This can help design promotions, such as offering discounts for bundled purchases.
Why Should You Care?
Whether you’re an analyst, a business owner, or just someone curious about how data shapes the world, association rule mining is a fascinating tool to explore. It not only gives businesses a competitive edge but also helps create better customer experiences. Who doesn’t love a well-timed suggestion for something you didn’t realize you needed?
Tips to Get Started
Here’s the good news: You don’t need to start from scratch! Tools like R, RapidMiner, and even open-source libraries in Python (like mlxtend) make it easy to get your hands dirty with association rule mining. Begin small, analyze your own shopping list or website clicks—and see what connections you can uncover!
In a nutshell, association rule techniques help us uncover hidden relationships in data that can make a huge difference in decision-making. So, the next time you see that perfectly placed product suggestion, give a little nod to the algorithms working quietly behind the scenes!
Classification Tactics: Sorting Data for Deeper Understanding
Have you ever wondered how computers seem to know what’s what when processing massive amounts of data? A big part of their smarts comes down to classification. When we talk about classification in data mining, we’re essentially talking about organizing data into predefined categories or groups. Think of it like sorting a giant pile of laundry, only instead of whites and colors, we’re sorting credit card transactions, photos, or even web search results. Let’s dive into the what, why, and how, shall we?
What is Classification, Exactly?
Classification is a supervised learning technique in data mining. Sounds fancy, right? Don’t worry, it just means that the computer learns from example cases (a.k.a. the training data) to predict which category something belongs to. For instance, imagine you’re trying to figure out if an email is spam or not. By feeding the system labeled examples of past emails, it learns patterns to label future emails as “spam” or “not spam.”
It’s worth noting that classification isn’t random guesswork, it’s guided by algorithms that are way smarter than we give them credit for. Common algorithms for classification include decision trees, support vector machines (SVM), and random forests (yep, there’s a reason that term sounds magical!).
Why is Classification So Important?
Great question! Classification techniques help make sense of chaos in a way that drives real-world decision-making. Companies, researchers, and governments rely heavily on classification methods to extract meaning from their data and act on it effectively. Here are some examples of its importance:
- Medical Field: Classifying whether a patient has a disease based on symptoms or diagnostic test results.
- Finance: Spotting fraudulent transactions by categorizing behaviors as suspicious or normal.
- Marketing: Targeting ads to the right audience by categorizing customers based on preferences or behaviors.
- Social Media: Understanding user sentiment and categorizing content for moderation (e.g., labeling posts as harmful or harmless).
In short, classification turns raw data into actionable insights, allowing us to make predictions, solve problems, and better serve people in almost every field imaginable.
How Does It Work?
Let’s break down the classification process into a few easy-to-understand steps:
- Training the Model: First, we feed the algorithm a set of labeled data. In this phase, the system looks for patterns in the examples it’s been given.
- Testing and Validation: Not so fast! Before a classification model is put to work, it’s tested with new data (data not included in training) to evaluate how accurately it performs.
- Categorizing New Data: Once the model proves it’s reliable, it’s ready to classify brand-new, unlabeled data. For example, it might efficiently label a fresh batch of emails as “spam” or “inbox-worthy.”
Best Practices for Classifying Data
Whether you’re diving into classification yourself or hiring someone who is, here are some expert tips to ensure success:
- Start with Quality Data: Garbage in, garbage out! Ensure your training dataset is accurate, clean, and diverse for maximum algorithm performance.
- Choose the Right Model: There’s no one-size-fits-all here. For instance, decision trees work well for interpretable results, while neural networks are ideal for complex tasks like image recognition.
- Evaluate and Tune: Keep your model sharp by continuously testing its accuracy and fine-tuning it with fresh, updated data.
Why You Should Care
Classification tactics may sound like something only tech giants or statisticians need, but the reality is that it’s everywhere. From detecting spam emails to predicting stock market trends, understanding classification techniques can empower you to make sense of the data-driven world around you.
Next time you see a “suggested post” on your social feed or hear about a medical breakthrough, remember that classification was likely a big part of getting that information to you. Who knows—maybe one day you’ll even find yourself building a classification model of your own!
Predictive Processes: Using Data Trends for Forecasting
Predictive data mining is where the magic happens. It’s like having a crystal ball for your data, helping you peek into what might come next based on the patterns we see right now. It’s a powerful tool that businesses, researchers, and even governments use to make smarter decisions and plan for the future. Sounds cool, right? Let’s dive in and explore how this works and why it’s so important.
What Exactly Is Predictive Data Mining?

At its core, predictive data mining uses current and historical data to identify trends and patterns that can help forecast future events. It’s all about being proactive rather than reactive. Instead of waiting for something unexpected to happen, predictive analytics prepares you to tackle problems, seize opportunities, and optimize outcomes ahead of time.
If you’ve ever noticed how Netflix suggests movies based on what you’ve watched or how e-commerce websites predict what you might want to buy next—you’ve experienced predictive data mining in action. It’s not just limited to streaming and shopping, though. It’s used in healthcare, finance, marketing, sports, and countless other areas. The applications are endless!
How Does It Work?
There’s no magic spell here, just some really smart algorithms and mathematical models doing all the work behind the scenes. Predictive data mining is powered by machine learning and statistical techniques. Here’s a simplified breakdown of the process:
- Gathering Data: First step, bring all your data together. Be it sales records, user behaviors, or customer feedback, you need a good foundation to build predictions.
- Preprocessing Data: Before analysis, the data needs some cleaning. Noise and inconsistencies are removed to ensure analysis is accurate.
- Identifying Patterns: Algorithms kick in to spot recurring trends or connections, like recognizing seasonal buying habits or spikes in customer activity.
- Building Models: Once patterns are established, predictive models are created. Think of these as blueprints to forecast future trends.
- Making Predictions: Finally, the insights flow in! Predictive data mining helps you plan better, from estimating stock demands to detecting risks before they escalate.
Why Does It Matter?
Predictive processes are changing the way organizations operate. Businesses can streamline strategies, doctors can identify health risks sooner, and governments can plan public services more efficiently. The benefits of predictive analysis extend far beyond just making decisions, it helps in saving time, money, and even lives.
Examples of Predictive Data Mining in Real Life
- Finance: Banks use predictive models to detect fraud by flagging unusual transactions swiftly.
- Healthcare: Hospitals can anticipate disease outbreaks or high patient admissions and adapt resources accordingly.
- Retail: Companies forecast inventory needs based on consumer trends, preventing overstock or undersupply issues.
- Weather Forecasting: Meteorology leverages predictive analytics daily to give us weather alerts.
Best Practices for Predictive Success
To truly harness the power of predictive processes, it’s important to keep a few golden rules in mind:
- High-quality data is key. Garbage in, garbage out, right?
- Use the right algorithms: Not all models fit every dataset. Choose wisely!
- Constantly update models: Trends change fast. Keep your predictions fresh and relevant by regularly tweaking your models.
Predictive data mining is your ally in staying ahead and making informed decisions across any domain. With the right approach, you can make the leap from reacting to problems to forecasting and solving them before they even arrive!
Outlier Detection: Identifying the Unusual in Data Sets
When it comes to data mining, not everything fits neatly into a pattern. Some data points stand out, waving flags that scream, “Hey! I’m different!” These anomalies or outliers are more than just interesting—identifying them is vital for robust data analysis. Let’s dive into why outliers matter, how to find them, and what they can teach us about your data.
What Are Outliers, and Why Should We Care?
Outliers are data points that deviate significantly from the rest of your data set. Picture a group of friends sitting around a campfire sharing stories, and suddenly, one starts talking about space aliens when everyone else is chatting about hiking. That’s an outlier! It’s rare, unexpected, and, quite often, deeply impactful. Outliers may indicate errors, fraud, or rare but important events.
For example:
- In fraud detection, an outlier might indicate a suspicious transaction, like someone buying a plane ticket from London to Tokyo five minutes after one from New York to Berlin.
- In healthcare, outliers in patient data could reveal unusual symptoms that help identify unique diseases or conditions.
- In business forecasting, outliers might identify unexpected opportunities or risks, like an unknown product segment flourishing without much marketing effort.
While outliers don’t always lead to groundbreaking discoveries, ignoring them could mean missing pivotal insights. And sometimes, removing these outliers is essential to ensure your analysis isn’t skewed.
How Do You Detect Outliers?
Spotting outliers can be challenging, but the good news is that there are many techniques to help. Here are a few of the most commonly used methods, broken down so they’re easy to grasp:
- Z-Score Analysis: The Z-score measures how far a data point is from the average value in terms of standard deviations. If a point has a very high or low Z-score, it’s likely an outlier. It’s simple, effective, and works great with normal data distributions.
- Box Plots: These visual tools quickly highlight outliers. Data points outside the “whiskers” of a box plot suggest they might be anomalous. Plus, it’s an easy technique to explain to people unfamiliar with deep statistical concepts.
- DBSCAN (Density-Based Spatial Clustering of Applications with Noise): For those working with spatial or clustered data, DBSCAN is your friend. It identifies dense areas while flagging less-dense, outlying points—perfect for use cases involving geolocation or sensor data.
- Isolation Forest: A machine learning technique that works by isolating outliers through iterative sampling. Highly effective and capable of handling large data sets, this method is becoming increasingly popular in complex datasets.
The Art of Decoding Outliers
Once you’ve detected outliers, the next step is to understand them. Not all anomalies are created equal. Some may result from simple data entry errors (e.g., someone accidentally entered “5000” instead of “50”), while others signal significant events worth exploring.
Here’s a tip: Always visualize your data when investigating outliers. Tools like scatter plots or heat maps can make it easier to see how outliers differ from the rest, minimizing guesswork and giving you rich context behind the numbers.
Outlier Detection as a Superpower
Think of outlier detection as a key skill in your data mining toolkit. It gives you the ability to uncover meaningful insights, clean up noisy data, and understand rare events that could shape the future. Whether you’re a data scientist, a business analyst, or just a curious mind, take some time to appreciate the value that unusual, unexpected, and out-of-the-box data can bring to the table. Who knows? The next outlier you find might just be the breakthrough you’ve been searching for!
Sequential Mining: Digging into Data Order and Timeflows
Hello there! Let’s dive into something that sounds fancy yet incredibly fascinating, Sequential Mining. It might sound like an archaeological dig for treasure, but instead of unearthing ancient artifacts, we’re uncovering patterns in the sequence or order of data over time. Grab your virtual pickaxe and let’s explore what this is all about!
What Exactly Is Sequential Mining?
Imagine you’re a store owner looking at your sales records. You notice patterns: customers who buy paintbrushes on Monday come back for paint on Friday. Or, perhaps you’re analyzing website traffic and spot that users who visit your blog are likely to purchase a product within a couple of days. That’s where sequential mining shines! It identifies patterns and dependencies in time-ordered data to give you actionable insights.
This type of data mining doesn’t just focus on recurring events or isolated interactions, it looks at the chain of events.
Why Does the “Order” of Things Matter?
- Understanding Behavior: In retail, knowing the sequence of purchases helps predict customer needs. If someone buys a smartphone, they might soon hunt for accessories like phone cases or chargers.
- Improving Processes: Sequential mining can optimize workflows in industries like manufacturing or logistics. It can spotlight inefficiencies in production or delivery chains!
- Forecasting Trends: In finance or healthcare, for instance, sequential patterns help flag risks. If certain stock prices dip, a corresponding action might quickly follow. Or, in patient care, symptoms appearing in a sequence could help predict outcomes or diagnoses.
- Refining Personalization: Industries like entertainment (think Netflix or Spotify) use customer behavior sequences to recommend your next favorite movie or song!
Famous Use Cases of Sequential Mining
Here are a few areas where sequential mining has made waves:
- Online Shopping: E-commerce websites track customer journeys. Sequential mining helps identify what users might buy next, driving personalized recommendations.
- Healthcare: Patient records often reveal sequential patterns in symptoms and treatments, this can lead to faster diagnoses and better therapies.
- Fraud Detection: Financial institutions use sequential mining to spot unusual transaction patterns that flag possible fraud, like spending spikes or abnormal geographic activity.
- Supply Chain Management: Sequential analysis can streamline orders, stock replenishments, and turn a disjointed process into a well-oiled machine!
How Do You Start Your Sequential Mining Journey?
Good news, it’s more approachable than you think! You’ll want to look at tools and methods that work with sequential data, including advanced algorithms like Sequential Pattern Matching. For beginners or small-scale needs, software like Python with libraries such as pandas and seaborn can help you start tinkering with ordered datasets.
One pro tip: Always ensure your data is clean and properly time-stamped. Garbage in, garbage out, as they say! Accurate timeflow is key to meaningful insights in sequential mining.
Wrapping It All Up
Sequential mining is not limited to nerdy data science labs, it’s used everywhere from your favorite streaming apps to life-saving healthcare breakthroughs. By studying the order of events, you’re not just looking at data but understanding the story it tells. And who doesn’t love a good story?
So, whether you’re tracking customer habits, improving processes, or forecasting the future, sequential mining helps you connect the dots, one step at a time (pun intended). Now, go out there and uncover some awesome sequences!
VII. Visualization-Driven Methods: Presenting Data Stories Effectively
Ah, visualization! It’s where your data transforms from dry numbers and complex algorithms into something dazzling and understandable. Think of it as the art gallery of data mining, a place where your insights are no longer locked inside endless spreadsheets but are showcased in beautiful, easily digestible visuals. So, let’s dive into how visualization-driven methods can elevate your data mining process and why they’re essential for anyone who wants to make data come to life.
Why Is Visualization So Powerful?
Humans are visual creatures. We process images much faster than text or raw numbers, which makes visualization-driven methods one of the most engaging ways to convey your findings. It’s not just about making charts that look pretty; it’s about building tools to tell a compelling story.
When done well, these methods help simplify complex datasets, highlight actionable insights, and even reveal trends or anomalies that you might otherwise miss. Imagine trying to spot a pattern in a table with a million rows versus seeing it pop out instantly on a beautifully color-coded graph. Exactly, the right visualization saves time, effort, and often, significant head-scratching!
Key Techniques for Data Visualization
There’s a whole toolbox of visualization-driven methods designed to cater to different data types and use cases. Here are some popular ones:
- Scatter Plots: Great for finding relationships between two variables. Want to know if higher income correlates with healthier eating habits? Plot it out!
- Heatmaps: Perfect for displaying data density or intensity. Heatmaps are especially useful in fields like retail, where you might map out the most popular areas of your store.
- Dashboards: A dashboard isn’t a single visualization but a collection, bringing together line graphs, bar charts, and performance indicators for a comprehensive overview.
- Interactive Visualizations: Tools like Tableau or Power BI allow users to click, filter, and manipulate data views. This dynamic approach is amazing for stakeholder presentations or deeper end-user analysis.
Tools to Turn You Into a Visualization Rockstar
So, where do you start? If you’re totally new to this, tools like Excel are a friendly entry point. But as you level up, specialized platforms such as Tableau, R (ggplot2), and Python (Matplotlib/Seaborn) can give your visuals the wow factor.
Remember, it’s not just about knowing how to use the tools—it’s also understanding when to use them. Line charts make sense for trends, while pie charts should perhaps be reserved for very simple distributions. (Let’s be honest—most of us have seen pie charts that are more confusing than clarifying!)
Common Pitfalls to Avoid
No matter how stunning your visuals look, there are some universal traps to watch out for:
- Overloading Your Visuals: Simplicity is key! Too much detail can overwhelm viewers and hide the insights you’re trying to spotlight.
- Misleading Representations: Always keep your scales and proportions honest. A small tweak to an axis can create a dramatic (and inaccurate) perception.
- Ignoring Accessibility: Color-blind-friendly palettes, proper labels, and descriptive captions are a must. Make sure your visuals are as inclusive as your data analysis.
How Visualization Connects Data and Decision-Makers
Ultimately, visualization-driven methods bridge the gap between raw data and real-world decisions. A well-crafted visualization doesn’t just show you the numbers, it interprets them, reveals trends, and encourages action. Whether you’re presenting to a boardroom, analyzing customer behaviors, or just trying to spot opportunities, remember: your data deserves to shine! And through thoughtful, creative visualizations, it can do just that.