
Types of Graphs and Charts (With Examples)
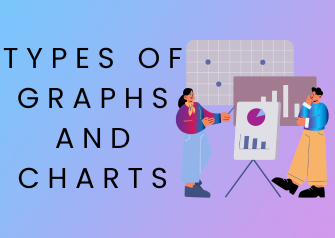
Understanding types of graphs and charts is essential for presenting data clearly and making better decisions. Whether you’re working on a school project, business report, or data analytics dashboard, the right visual can turn complex numbers into easy-to-understand insights. Different types of graphs and charts are designed for specific purposes. Some help compare values, others […]
Best Free Chart Makers Online (No Signup) Tools

Creating charts shouldn’t require complicated software or signups. Whether you’re a student preparing a report, a marketer visualizing campaign data, or an analyst crunching numbers, quick visualizations are key. That’s why free chart makers online with no signup are so useful – they’re instant graph generators that let you build […]
Which Chart Should You Use? (Complete Chart Selection Guide)
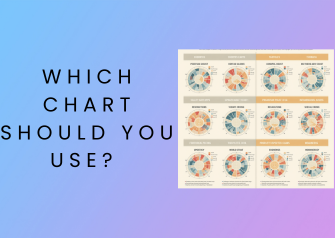
If you’ve ever looked at your data and wondered, “which chart should you use?”, you’re not alone. Choosing the right chart is one of the biggest challenges in data visualization. Pick the wrong chart, and your data becomes confusing, or worse, misleading. Pick the right one, and your insights become instantly clear. This chart selection […]
How to Present Data in Reports (With Examples)

Knowing how to present data in reports is essential for turning raw numbers into meaningful insights. Many reports fail not because the data is wrong, but because it’s poorly presented, making it confusing and hard to understand. Whether you’re creating a business report, academic paper, or marketing analysis, clear data presentation can make your message […]
Best Data Visualization Tools for Beginners
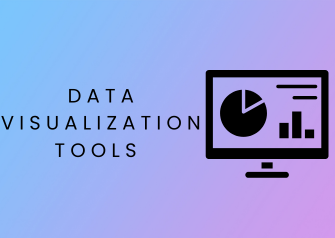
choosing the best data visualization tools for beginners can feel confusing. There are dozens of platforms available, each offering different features, pricing, and levels of complexity. The good news? You don’t need advanced technical skills to create powerful charts and visuals anymore. Modern data visualization tools make it easy to turn raw data into clear, […]
How to Visualize Data (Step-by-Step Guide)
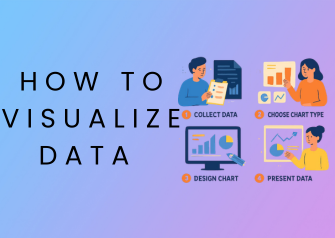
If you’ve ever looked at a spreadsheet full of numbers and felt overwhelmed, you’re not alone. Raw data can be difficult to understand, even for experienced professionals. That’s where learning how to visualize data becomes essential. Data visualization transforms complex information into clear, visual formats like charts and graphs. It helps you quickly identify patterns, […]