
Anon Vault: Complete Guide to Anonymous Cloud Storage, Privacy, Security, Risks & Alternatives

Online privacy has become a major concern for individuals and businesses alike. Traditional cloud storage platforms often require personal information, track user activity, and store metadata that can reveal details about how files are accessed and shared. As concerns about data collection continue to grow, many users are searching for privacy-focused alternatives that offer greater […]
Why Data and Analytics Are Key to Digital Transformation
Businesses today generate huge amounts of data from websites, mobile apps, customer interactions, social media, sales systems, and digital tools. However, collecting data alone is not enough. The real value comes from understanding and using that data to improve decisions and business performance. This is exactly why data and analytics are key to digital transformation. […]
Is Google Data Analytics Certificate Worth It?
If you are wondering is Google Data Analytics Certificate worth it, the short answer is yes for many beginners, career changers, and students. The demand for data analysts continues to grow as companies rely more on data to make business decisions. Because of this, many people are looking for affordable and beginner-friendly ways to enter […]
How to Implement Data Analytics in Your Business
Businesses generate more data today than ever before. From website traffic and customer behavior to sales reports and marketing campaigns, data is collected at every stage of operations. However, collecting data alone does not improve business performance. Many companies struggle because they do not know how to organize, analyze, and use that data effectively. Data […]
Types of Graphs and Charts (With Examples)
Understanding types of graphs and charts is essential for presenting data clearly and making better decisions. Whether you’re working on a school project, business report, or data analytics dashboard, the right visual can turn complex numbers into easy-to-understand insights. Different types of graphs and charts are designed for specific purposes. Some help compare values, others […]
Best Free Chart Makers Online (No Signup) Tools

Creating charts shouldn’t require complicated software or signups. Whether you’re a student preparing a report, a marketer visualizing campaign data, or an analyst crunching numbers, quick visualizations are key. That’s why free chart makers online with no signup are so useful – they’re instant graph generators that let you build […]
Which Chart Should You Use? (Complete Chart Selection Guide)
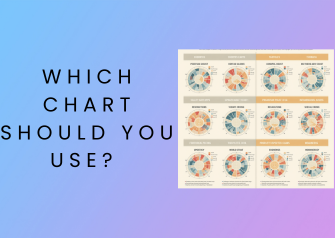
If you’ve ever looked at your data and wondered, “which chart should you use?”, you’re not alone. Choosing the right chart is one of the biggest challenges in data visualization. Pick the wrong chart, and your data becomes confusing, or worse, misleading. Pick the right one, and your insights become instantly clear. This chart selection […]
How to Present Data in Reports (With Examples)
Knowing how to present data in reports is essential for turning raw numbers into meaningful insights. Many reports fail not because the data is wrong, but because it’s poorly presented, making it confusing and hard to understand. Whether you’re creating a business report, academic paper, or marketing analysis, clear data presentation can make your message […]
Best Data Visualization Tools for Beginners
choosing the best data visualization tools for beginners can feel confusing. There are dozens of platforms available, each offering different features, pricing, and levels of complexity. The good news? You don’t need advanced technical skills to create powerful charts and visuals anymore. Modern data visualization tools make it easy to turn raw data into clear, […]
How to Visualize Data (Step-by-Step Guide)
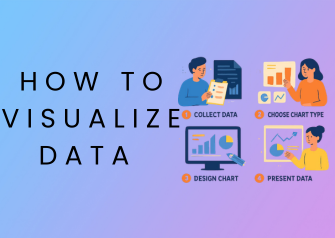
If you’ve ever looked at a spreadsheet full of numbers and felt overwhelmed, you’re not alone. Raw data can be difficult to understand, even for experienced professionals. That’s where learning how to visualize data becomes essential. Data visualization transforms complex information into clear, visual formats like charts and graphs. It helps you quickly identify patterns, […]