Businesses generate more data today than ever before. From website traffic and customer behavior to sales reports and marketing campaigns, data is collected at every stage of operations. However, collecting data alone does not improve business performance. Many companies struggle because they do not know how to organize, analyze, and use that data effectively.
Data analytics implementation is the process of transforming raw information into actionable insights that support smarter business decisions. It is not just about purchasing software or creating dashboards. A successful implementation requires clear business goals, reliable data sources, the right analytics tools, skilled teams, and a structured strategy.
When implemented correctly, data analytics helps businesses identify trends, improve customer experiences, reduce operational costs, increase efficiency, and make faster decisions based on evidence rather than assumptions. Whether you run a small business or a large enterprise, a proper analytics framework can create a significant competitive advantage.
This step-by-step guide explains how to implement data analytics effectively, starting with the core implementation process before moving into tools, costs, frameworks, challenges, and best practices.
Step-by-Step Guide to Implement Data Analytics

Understanding how to implement data analytics is essential for businesses that want to make smarter decisions using real data instead of assumptions. A successful implementation requires a structured process that connects business goals, data collection, analytics tools, and continuous improvement. Below is a practical step-by-step guide to implementing data analytics effectively.
Define Your Business Goals
The first step in learning how to implement data analytics is defining clear business goals. Many companies start collecting data without understanding what they actually want to improve. As a result, they end up with large amounts of information but no actionable insights.
Before gathering data or choosing analytics tools, identify the specific business problems you want to solve. Your goals should align with your company’s overall strategy and focus on measurable outcomes. Clear objectives help teams determine which data is important, what KPIs should be tracked, and how success will be measured.
For example, businesses may use data analytics to:
- Increase website conversions by understanding user behavior
- Reduce customer churn by identifying why customers leave
- Improve sales forecasting through historical sales analysis
- Lower operational costs by finding process inefficiencies
Well-defined business goals create the foundation for a successful data analytics implementation strategy and ensure that analytics efforts deliver real business value.
Questions to Ask Before Starting
Before implementing data analytics, businesses should ask a few important questions to ensure the strategy aligns with their goals and decision-making process. These questions help identify the purpose of the analytics project and prevent wasting time on irrelevant data.
Key questions include:
- What business problem are we trying to solve?
- Which metrics or KPIs matter the most?
- What decisions will this data support?
- Which departments will use the insights?
- How will success be measured?
Answering these questions early creates a clear roadmap for data collection, analysis, and reporting.
| Business Goal | KPI Example |
|---|---|
| Increase sales | Conversion rate |
| Improve customer retention | Customer churn rate |
| Reduce operational costs | Operational expenses |
| Improve marketing performance | Customer acquisition cost |
| Increase customer satisfaction | Net Promoter Score (NPS) |
Identify the Right Data Sources
After defining your business goals, the next step in how to implement data analytics is identifying the right data sources. Businesses generate data from multiple systems every day, but not all data is useful for analysis. The key is to collect accurate, relevant, and consistent information that directly supports your business objectives.
Choosing the right data sources for analytics helps organizations gain a complete view of customer behavior, operational performance, sales trends, and marketing effectiveness. When data is collected from multiple connected systems, businesses can make more informed and data-driven decisions.
Some of the most common data sources for analytics include:
- Website analytics – Track user behavior, traffic sources, bounce rates, and conversions
- CRM software – Store customer interactions, sales pipelines, and lead management data
- ERP systems – Manage operational, financial, inventory, and supply chain data
- Mobile apps – Monitor user engagement, app performance, and in-app behavior
- Customer support platforms – Analyze support tickets, response times, and customer satisfaction
- Social media channels – Measure audience engagement, reach, and campaign performance
- Marketing campaigns – Track email performance, paid advertising results, and lead generation metrics
Businesses should focus on integrating data from all important departments to create a centralized and reliable analytics system. High-quality data sources improve reporting accuracy, uncover valuable insights, and support better business decisions.
Structured vs Unstructured Data

When implementing data analytics, businesses work with two main types of data: structured data and unstructured data. Understanding the difference between them is important because both provide valuable insights and require different methods of storage and analysis.
Structured data is highly organized and stored in a fixed format, making it easy to search, filter, and analyze. This type of data is commonly stored in spreadsheets, databases, and tables with clearly defined rows and columns. Because it follows a consistent structure, businesses can quickly process structured data using traditional analytics tools and SQL queries.
Examples of structured data include:
- Sales records
- Customer databases
- Financial reports
- Inventory spreadsheets
- Employee information systems
Unstructured data, on the other hand, does not follow a predefined format. It is more complex and often contains text, images, audio, or video content. Analyzing unstructured data usually requires advanced technologies such as artificial intelligence, machine learning, or natural language processing.
Examples of unstructured data include:
- Emails
- Chat messages
- Customer reviews
- Social media posts
- Videos and images
- Support call recordings
Both structured and unstructured data are valuable for modern businesses. Structured data helps track measurable performance metrics, while unstructured data provides deeper insights into customer opinions, behaviors, and experiences. A successful data analytics strategy combines both types of data to generate more accurate and meaningful business insights.
Set Up Data Collection
After identifying the right data sources, the next step in the data collection process is building a reliable system to collect data consistently and accurately. Proper data collection ensures that businesses receive real-time, high-quality information that can be used for reporting, analysis, and decision-making.
A strong data collection system helps organizations avoid missing data, duplicate records, and inaccurate insights. It also ensures that information from different platforms is connected and centralized for easier analysis.
Key components of a successful data collection process include:
- Tracking codes – Small snippets of code added to websites or applications to monitor user activity, page visits, clicks, and conversions
- APIs (Application Programming Interfaces) – Allow different software systems to exchange and synchronize data automatically
- Event tracking – Records specific user actions such as button clicks, downloads, purchases, or form submissions
- Data pipelines – Automated workflows that move data from multiple sources into storage systems like data warehouses or analytics platforms
- Real-time tracking setup – Enables businesses to monitor live data instantly for faster decision-making and immediate insights
Businesses should focus on creating automated and scalable data collection systems to reduce manual work and improve data accuracy. Consistent data collection is essential for generating reliable analytics reports and supporting long-term business growth.
Common Mistakes During Data Collection
Many businesses struggle with inaccurate analytics because of poor data collection practices. Even small errors during the collection process can lead to misleading reports, incorrect insights, and poor business decisions. Identifying and avoiding common mistakes helps maintain data quality and improves the accuracy of analytics systems.
Some of the most common data collection mistakes include:
- Missing tracking events – Important user actions such as purchases, form submissions, or button clicks may not be tracked properly, leading to incomplete data and inaccurate reporting.
- Duplicate records – The same data may be collected multiple times due to system errors or integration issues, causing inflated metrics and unreliable analysis.
- Inconsistent naming conventions – Different teams may use different names for the same campaign, event, or metric, making data difficult to organize and analyze consistently.
Other common issues include collecting irrelevant data, failing to validate information, and not monitoring tracking systems regularly. Businesses should perform routine audits and standardize their data collection process to ensure analytics results remain accurate and trustworthy.
Clean and Organize the Data

One of the most important stages in the data cleaning process is preparing raw data for accurate analysis. Data collected from multiple sources is often incomplete, inconsistent, or disorganized. If businesses analyze poor-quality data, the results can lead to incorrect insights and poor decision-making.
Cleaning and organizing data ensures that analytics systems work efficiently and generate reliable reports. High-quality data improves forecasting, reporting accuracy, and overall business intelligence.
The data cleaning process typically includes the following tasks:
- Remove duplicate entries – Eliminate repeated records that can distort analytics results and inflate performance metrics.
- Fix missing values – Identify incomplete information and either fill in missing data, replace it with estimated values, or remove unusable records.
- Standardize formats – Ensure consistency in dates, currencies, names, and measurement units across all datasets.
- Validate accuracy – Check data for errors, incorrect values, and inconsistencies to maintain reliability and trustworthiness.
Businesses should also create data governance rules and automated validation checks to maintain clean and organized datasets over time. Properly cleaned data creates a strong foundation for accurate analytics and smarter business decisions.
Why Data Cleaning Matters
Data cleaning is a critical part of any successful analytics strategy because the quality of insights depends entirely on the quality of the data being analyzed. If businesses work with inaccurate, incomplete, or outdated information, they risk making poor decisions that can negatively impact performance, revenue, and customer experience.
Poor-quality data can lead to:
- Incorrect business forecasts
- Misleading reports and dashboards
- Wasted marketing budgets
- Duplicate customer records
- Operational inefficiencies
- Poor customer targeting
Clean and organized data improves accuracy, reliability, and consistency in analytics. It helps businesses generate trustworthy insights, identify real trends, and make confident data-driven decisions. Regular data cleaning also improves system performance and ensures that analytics tools deliver meaningful and actionable results.
Choose Data Analytics Tools
Selecting the right data analytics tools is an important step in building an effective analytics system. The tools you choose should match your business goals, budget, technical skills, and data requirements. Good analytics tools help businesses collect, visualize, analyze, and interpret data more efficiently.
For small businesses, it is often best to start with affordable and user-friendly tools that are easy to implement and scale over time. These tools can provide valuable insights without requiring a large technical team or complex infrastructure.
Tools for Small Businesses
- Google Analytics – A powerful web analytics platform used to track website traffic, user behavior, conversions, and marketing performance. It is widely used for understanding how visitors interact with websites and digital campaigns.
- Looker Studio – A free data visualization and reporting tool that helps businesses create interactive dashboards and share real-time reports using data from multiple sources.
- Excel – One of the most commonly used tools for basic data analysis, reporting, calculations, charts, and spreadsheet management. It is ideal for small datasets and simple analytics tasks.
- Power BI – A business intelligence tool by Microsoft that allows businesses to create advanced dashboards, visualize data, and generate detailed reports from multiple integrated data sources.
When choosing data analytics tools, businesses should focus on ease of use, scalability, integration capabilities, reporting features, and overall cost. The right tools make it easier to turn raw data into meaningful business insights and support better decision-making.
Enterprise Analytics Tools
Large organizations often require advanced data analytics tools capable of processing massive datasets, supporting real-time analytics, and integrating with complex business systems. Enterprise-level platforms provide scalability, automation, cloud computing, and advanced analytics capabilities.
- Tableau – A leading business intelligence platform used for advanced data visualization, interactive dashboards, and enterprise reporting.
- Snowflake – A cloud-based data warehouse designed for storing, managing, and analyzing large volumes of business data efficiently.
- Databricks – A unified analytics platform that combines data engineering, machine learning, and AI-powered analytics for enterprise use.
- Apache Spark – An open-source big data processing engine used for real-time analytics, large-scale data processing, and machine learning applications.
How to Choose the Right Tool
Choosing the right data analytics tool depends on your business size, goals, technical expertise, and future scalability needs. Before selecting a platform, businesses should evaluate several important factors:
- Budget – Consider software licensing, implementation, maintenance, and training costs.
- Scalability – Ensure the tool can handle growing data volumes and future business expansion.
- Ease of use – User-friendly platforms improve adoption among non-technical teams.
- Integration support – The tool should connect easily with existing business systems and data sources.
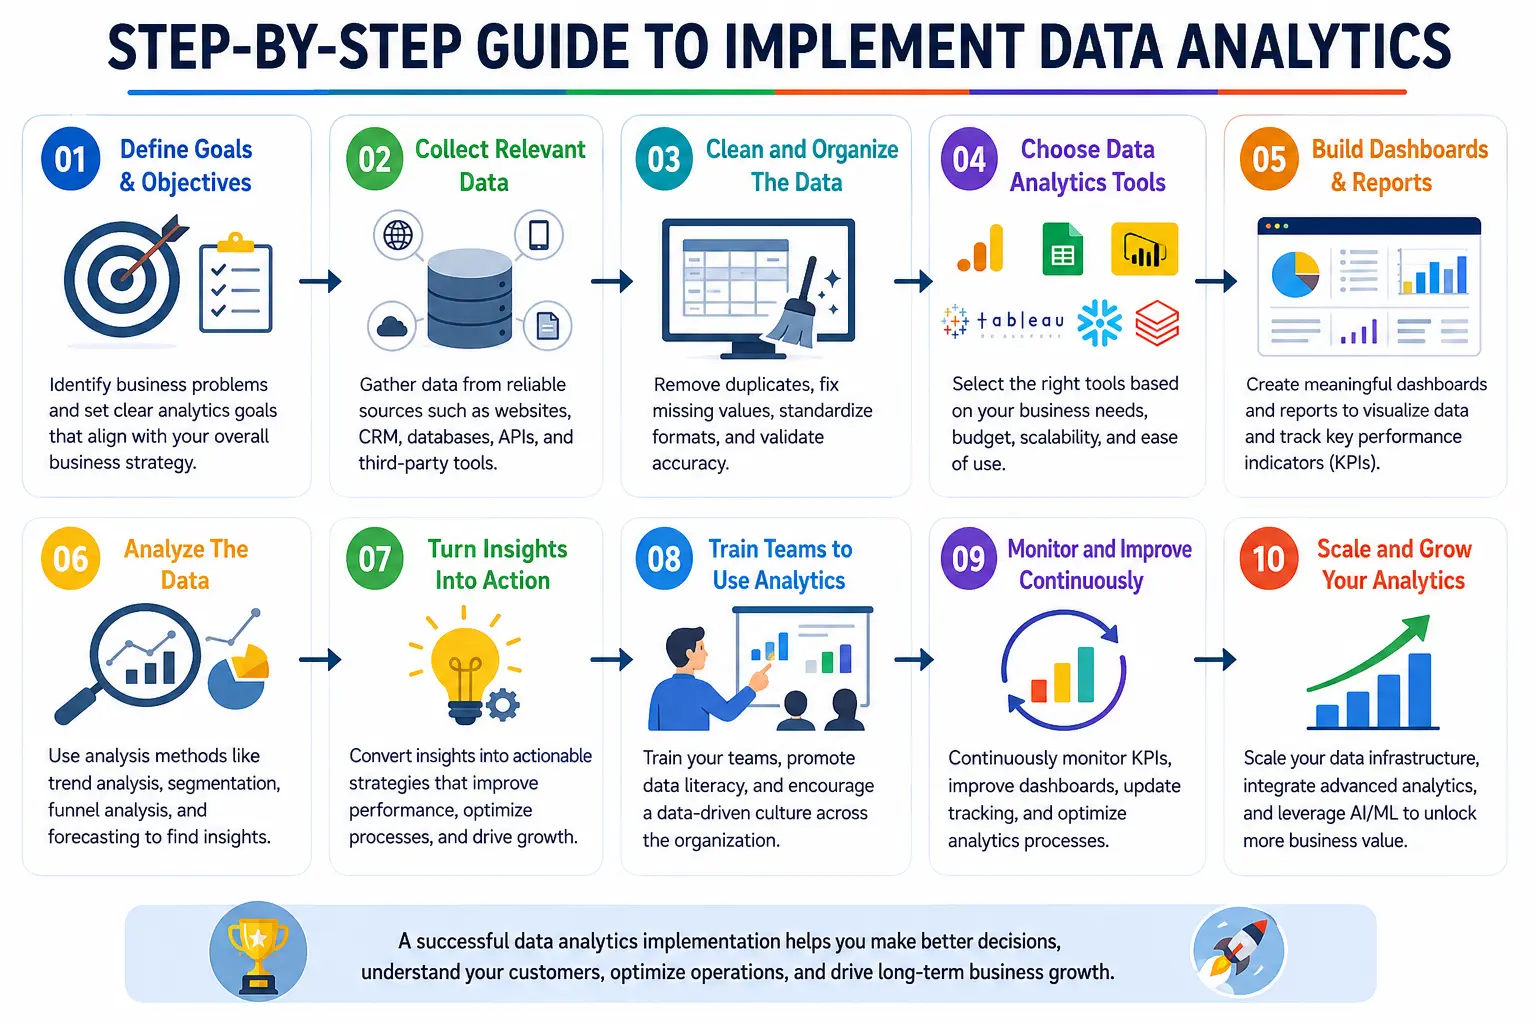
Build Dashboards and Reports
Once the data is collected and organized, businesses need to present it in a way that teams can understand quickly. Analytics dashboards help organizations monitor performance, track KPIs, and identify trends in real time.
Well-designed dashboards simplify complex data and support faster decision-making across departments.
Dashboard Types
- Executive dashboards – Provide high-level business insights for leadership teams and executives.
- Marketing dashboards – Track campaign performance, traffic sources, leads, and advertising ROI.
- Sales dashboards – Monitor sales performance, revenue, pipeline progress, and conversion metrics.
- Operational dashboards – Track business operations, productivity, inventory, and process efficiency.
Metrics Businesses Commonly Track
Businesses typically monitor key performance indicators (KPIs) such as:
- Revenue
- Customer acquisition cost (CAC)
- Website traffic
- Conversion rates
- Customer retention
Analyze the Data
After building dashboards and reports, the next step in the data analysis process is transforming raw information into meaningful business insights. Data analysis helps organizations identify patterns, trends, risks, and opportunities that support smarter decisions.
Common Analysis Methods
- Trend analysis – Identifies performance changes over time.
- Customer segmentation – Groups customers based on behavior, demographics, or purchasing habits.
- Funnel analysis – Tracks customer journeys and identifies where users drop off.
- Forecasting – Uses historical data to predict future outcomes and demand.
- Performance comparison – Compares departments, campaigns, or products to measure effectiveness.
Key Questions During Analysis
Businesses should ask important questions during the analysis stage:
- What changed?
- Why did it change?
- What action should we take?
Turn Insights Into Action
Data analytics only creates value when businesses use insights to improve decisions and operations. The goal of data-driven decision making is to turn analytics findings into measurable business outcomes.
Examples
Businesses can use analytics insights to:
- Improve ad targeting
- Optimize pricing strategies
- Reduce customer churn
- Improve product experience
- Increase operational efficiency
Why Many Analytics Projects Fail
Many organizations fail because they focus only on collecting reports instead of taking action. Successful analytics implementation requires businesses to use insights to solve problems, improve processes, and support strategic decisions.
Train Teams to Use Analytics
Creating a strong data-driven culture is essential for long-term analytics success. Even the best analytics systems fail if employees do not understand how to use data effectively.
Businesses should focus on:
- Team training programs
- Easy dashboard accessibility
- Cross-team collaboration
- Leadership involvement and support
When teams use analytics regularly, businesses become more efficient, data-focused, and responsive to market changes.
Monitor and Improve Continuously
Analytics implementation is not a one-time process. Businesses must continuously monitor performance and improve systems over time. Analytics optimization helps organizations maintain data accuracy, improve reporting, and scale their analytics infrastructure as the business grows.
Businesses Should:
- Review KPIs regularly
- Improve dashboards and reports
- Update tracking systems
- Scale infrastructure when needed
- Automate repetitive reporting processes
What Is Data Analytics Implementation?
Data analytics implementation is the process of collecting, organizing, analyzing, and using business data to support decision-making and improve performance. It involves combining data sources, analytics tools, reporting systems, and business strategies into a structured framework.
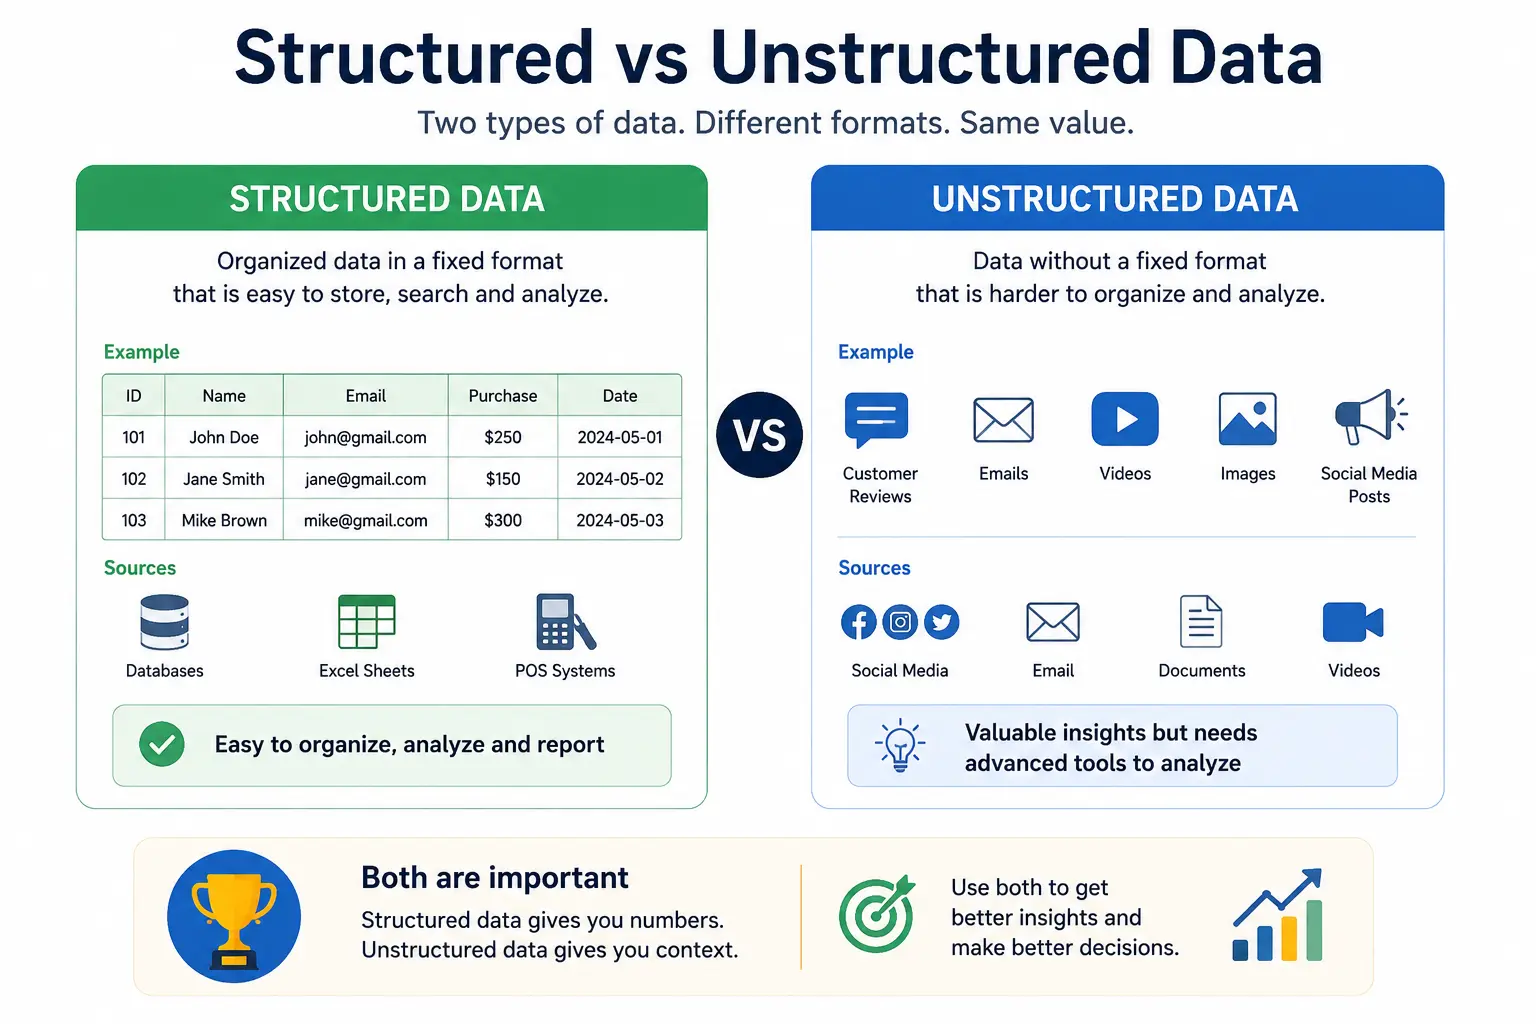
Difference Between Data Collection and Analytics
Data collection focuses on gathering raw information, while data analytics involves analyzing that information to generate insights and support business decisions.
Why Businesses Need Data Analytics
Businesses use analytics to:
- Improve decision-making
- Understand customer behavior
- Increase operational efficiency
- Reduce risks
- Improve marketing performance
- Forecast future trends
Types of Data Analytics
- Descriptive analytics – Explains what happened in the past.
- Diagnostic analytics – Identifies why something happened.
- Predictive analytics – Forecasts future outcomes using historical data.
- Prescriptive analytics – Recommends actions based on data insights.
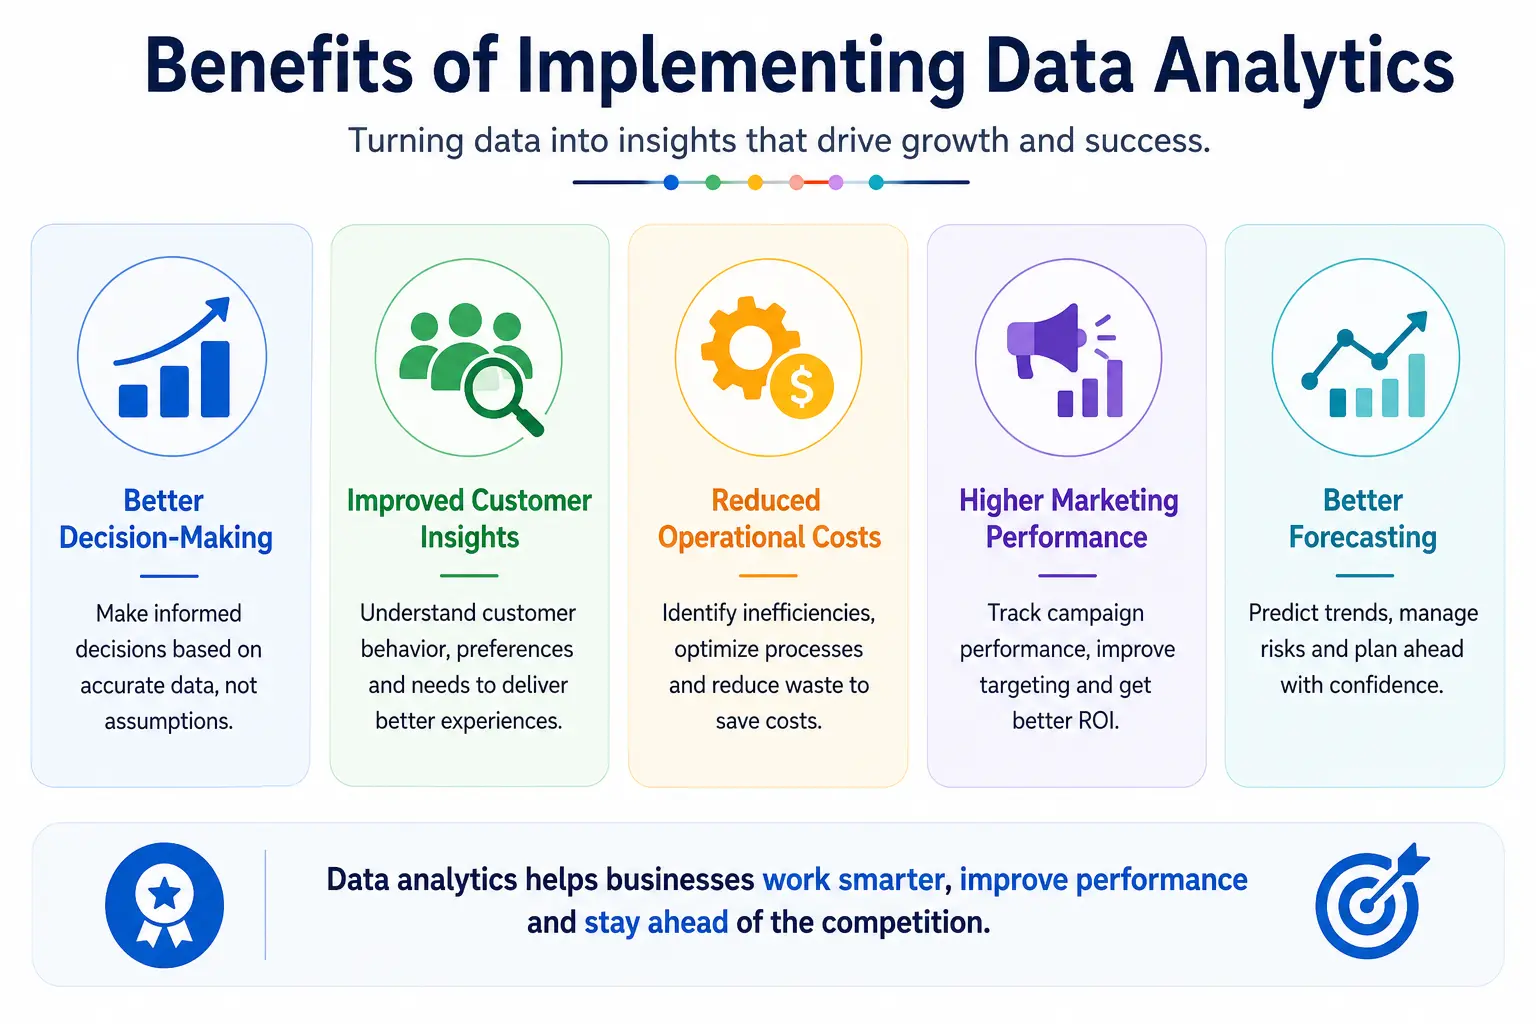
Benefits of Implementing Data Analytics

Better Decision-Making
Analytics helps businesses make informed decisions using accurate data instead of assumptions.
Improved Customer Insights
Businesses can better understand customer preferences, behaviors, and purchasing patterns.
Reduced Operational Costs
Analytics identifies inefficiencies and helps optimize business operations.
Higher Marketing Performance
Companies can measure campaign effectiveness and improve targeting strategies.
Better Forecasting
Historical data helps businesses predict trends, demand, and future performance more accurately.
Best Practices for Data Analytics Implementation
Start Small Before Scaling
Begin with small analytics projects before expanding across the organization.
Focus on Business Goals
Analytics should always align with business objectives and measurable outcomes.
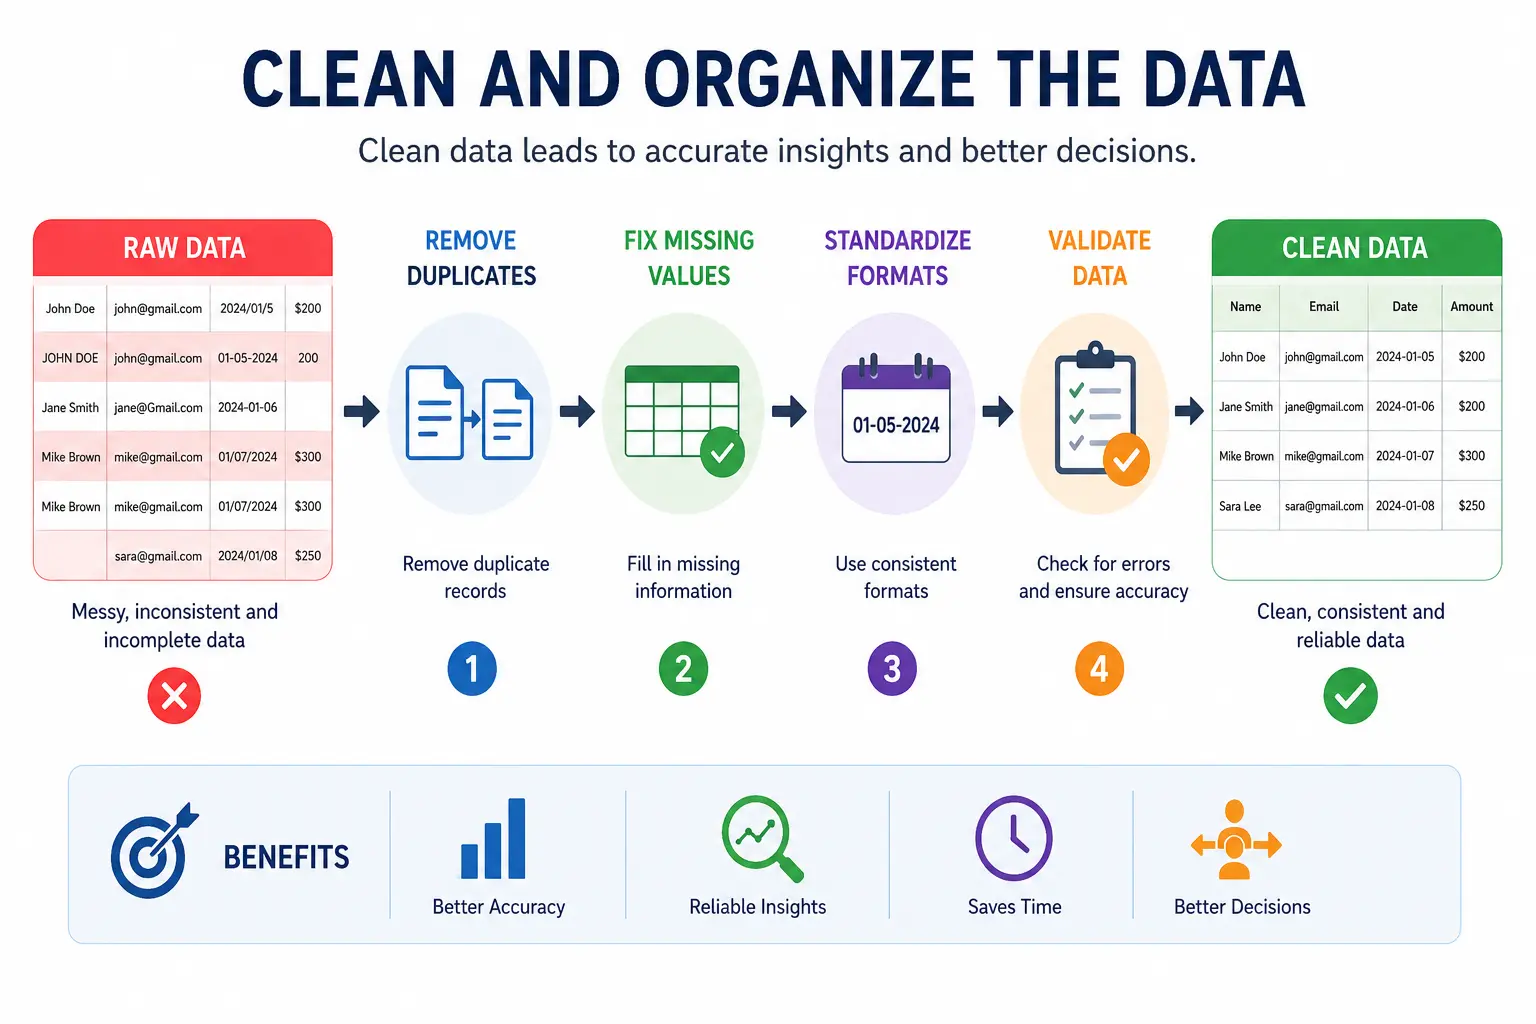
Maintain Data Quality
Clean, accurate, and consistent data improves reporting reliability.
Use Data Governance Policies
Establish rules for data access, privacy, security, and management.
Automate Repetitive Processes
Automation reduces manual work and improves efficiency.
Keep Dashboards Simple
Clear and user-friendly dashboards improve understanding and adoption.
Common Challenges in Data Analytics Implementation
Poor Data Quality
Inaccurate or incomplete data leads to unreliable insights.
Data Silos
Disconnected systems prevent businesses from creating a unified view of data.
Lack of Skilled Teams
Organizations may struggle to find employees with analytics expertise.
Integration Problems
Connecting multiple systems and platforms can be technically challenging.
High Costs
Analytics tools, infrastructure, and training can require significant investment.
Resistance to Change
Employees may resist adopting data-driven processes and technologies.
Best Data Analytics Tools
Analytics Tools for Beginners
- Google Analytics
- Looker Studio
- Microsoft Excel
Advanced Analytics Platforms
- Tableau
- Power BI
- Snowflake
- Apache Spark
AI-Powered Analytics Tools
- Google Cloud AI
- AWS Analytics
- Azure Synapse
Real-World Example of Data Analytics Implementation
The company experienced high cart abandonment rates during online purchases.
Data Sources Used
- Website analytics
- CRM software
- Purchase history data
Insights Found
Analytics revealed that users frequently dropped off during the checkout process.
Action Taken
The company simplified the checkout experience and reduced unnecessary form fields.
Result
The business achieved higher conversion rates and lower cart abandonment.
Cost of Implementing Data Analytics
Software Costs
Includes analytics platforms, dashboard tools, and reporting software subscriptions.
Infrastructure Costs
Businesses may need cloud storage, servers, or data warehouses.
Training Costs
Organizations must invest in employee training and analytics education.
In-House vs Outsourcing
Businesses can either build internal analytics teams or outsource implementation to specialized agencies.
How Long Does Data Analytics Implementation Take?
Small Businesses
Small businesses may implement basic analytics systems within a few weeks.
Mid-Sized Companies
Mid-sized organizations often require several months for integration and reporting setup.
Enterprises
Large enterprises may take six months or longer due to complex infrastructure and data systems.
Factors Affecting Timeline
- Team size
- Data volume
- Existing infrastructure
- Tool complexity
Future Trends in Data Analytics
AI-Powered Analytics
Artificial intelligence is improving automation and predictive insights.
Real-Time Analytics
Businesses increasingly rely on live data for faster decisions.
Predictive Analytics
Advanced forecasting models are becoming more accurate and accessible.
Self-Service BI Tools
More companies are adopting user-friendly business intelligence platforms.
Privacy-Focused Analytics
Organizations are prioritizing data security and privacy compliance.
Frequently Asked Questions
What is the first step in implementing data analytics?
The first step is defining clear business goals and identifying the problems analytics should solve.
Which tool is best for data analytics?
The best tool depends on business size, budget, and analytics needs. Popular options include Power BI, Tableau, and Google Analytics.
How do companies collect analytics data?
Businesses collect data through websites, CRM systems, apps, marketing tools, APIs, and tracking systems.
How much does implementation cost?
Costs vary depending on tools, infrastructure, training, and company size.
What are the biggest analytics challenges?
Common challenges include poor data quality, integration issues, high costs, and lack of skilled teams.
Can small businesses implement analytics?
Yes, small businesses can start with affordable tools like Google Analytics, Excel, and Looker Studio.
How long does implementation take?
Implementation timelines range from a few weeks for small businesses to several months for enterprises.
Conclusion
Implementing data analytics is not simply about collecting information or building dashboards. It is a structured process that helps businesses turn raw data into actionable insights and smarter decisions. From identifying business goals and collecting accurate data to analyzing trends and improving operations, every step plays an important role in creating a successful analytics strategy.
Businesses should focus on gradual implementation instead of trying to build a complex analytics system all at once. Starting small, maintaining data quality, training teams, and continuously improving processes can lead to long-term success.
Most importantly, analytics should always drive action. Reports and dashboards only become valuable when businesses use insights to improve customer experiences, optimize operations, reduce costs, and make better strategic decisions.


